

NEW_Accomplishments.indd - IRIS
NEW_Accomplishments.indd - IRIS
NEW_Accomplishments.indd - IRIS

Create successful ePaper yourself
Turn your PDF publications into a flip-book with our unique Google optimized e-Paper software.
GLOBAL MANTLE STRUCTURE<br />
2006 <strong>IRIS</strong> 5-YEAR PROPOSAL<br />
Seismic Evidence for Accumulated Oceanic Crust Above the 660-km<br />
Discontinuity Beneath Southern Africa<br />
Yang Shen • University of Rhode Island<br />
John Blum • University of California, San Diego<br />
High-pressure assemblages of subducted oceanic crust are denser than the normal upper mantle but less dense than the<br />
uppermost lower mantle (Ringwood, 1991; Hirose et al., 1999). Thus, subducted oceanic crust may accumulate at the base<br />
of the upper mantle. Direct observational evidence for this hypothesis, however, remains elusive. We present an analysis of<br />
a negative-polarity shear wave converted from a compressional wave at a seismic discontinuity near 570 - 600 km depth beneath<br />
southern Africa. The negative polarity of the converted phase indicates a ~2.2 ± 0.2% S-velocity decrease with depth at<br />
the seismic discontinuity. This velocity reduction is associated, however, with a low-velocity contrast at the 660-km discontinuity.<br />
The exsolution of Ca-perovskite in former oceanic crust at depths greater than 600 km and the associated small volume<br />
fraction of ringwoodite are plausible explanations for the apparent paradox between the negative velocity discontinuity and<br />
the low velocity contrast at the 660-km discontinuity.<br />
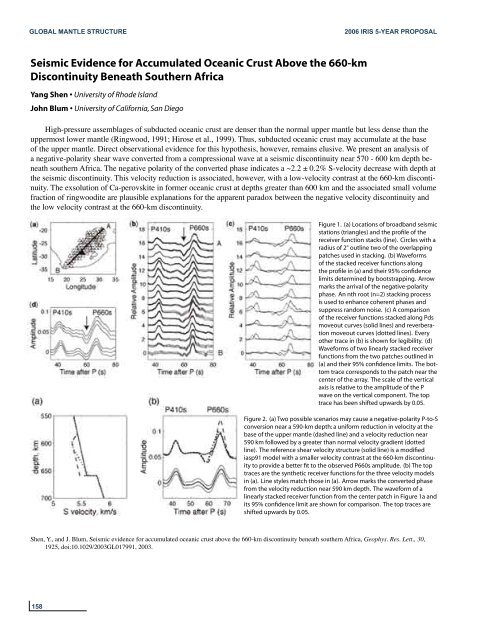
Figure 1. (a) Locations of broadband seismic<br />
stations (triangles) and the profile of the<br />
receiver function stacks (line). Circles with a<br />
radius of 2° outline two of the overlapping<br />
patches used in stacking. (b) Waveforms<br />
of the stacked receiver functions along<br />
the profile in (a) and their 95% confidence<br />
limits determined by bootstrapping. Arrow<br />
marks the arrival of the negative-polarity<br />
phase. An nth root (n=2) stacking process<br />
is used to enhance coherent phases and<br />
suppress random noise. (c) A comparison<br />
of the receiver functions stacked along Pds<br />
moveout curves (solid lines) and reverberation<br />
moveout curves (dotted lines). Every<br />
other trace in (b) is shown for legibility. (d)<br />
Waveforms of two linearly stacked receiver<br />
functions from the two patches outlined in<br />
(a) and their 95% confidence limits. The bottom<br />
trace corresponds to the patch near the<br />
center of the array. The scale of the vertical<br />
axis is relative to the amplitude of the P<br />
wave on the vertical component. The top<br />
trace has been shifted upwards by 0.05.<br />
Figure 2. (a) Two possible scenarios may cause a negative-polarity P-to-S<br />
conversion near a 590-km depth: a uniform reduction in velocity at the<br />
base of the upper mantle (dashed line) and a velocity reduction near<br />
590 km followed by a greater than normal velocity gradient (dotted<br />
line). The reference shear velocity structure (solid line) is a modified<br />
iasp91 model with a smaller velocity contrast at the 660-km discontinuity<br />
to provide a better fit to the observed P660s amplitude. (b) The top<br />
traces are the synthetic receiver functions for the three velocity models<br />
in (a). Line styles match those in (a). Arrow marks the converted phase<br />
from the velocity reduction near 590 km depth. The waveform of a<br />
linearly stacked receiver function from the center patch in Figure 1a and<br />
its 95% confidence limit are shown for comparison. The top traces are<br />
shifted upwards by 0.05.<br />
Shen, Y., and J. Blum, Seismic evidence for accumulated oceanic crust above the 660-km discontinuity beneath southern Africa, Geophys. Res. Lett., 30,<br />
1925, doi:10.1029/2003GL017991, 2003.<br />
158


