

NEW_Accomplishments.indd - IRIS
NEW_Accomplishments.indd - IRIS
NEW_Accomplishments.indd - IRIS

You also want an ePaper? Increase the reach of your titles
YUMPU automatically turns print PDFs into web optimized ePapers that Google loves.
2006 <strong>IRIS</strong> 5-YEAR PROPOSAL GLOBAL MANTLE STRUCTURE<br />
Whole-Mantle 3D Seismic Attenuation: Evidence for Global Mass Flux<br />
Jesse Fisher Lawrence • Washington University, now at University of California, San Diego<br />
Michael Wysession • Washington University<br />
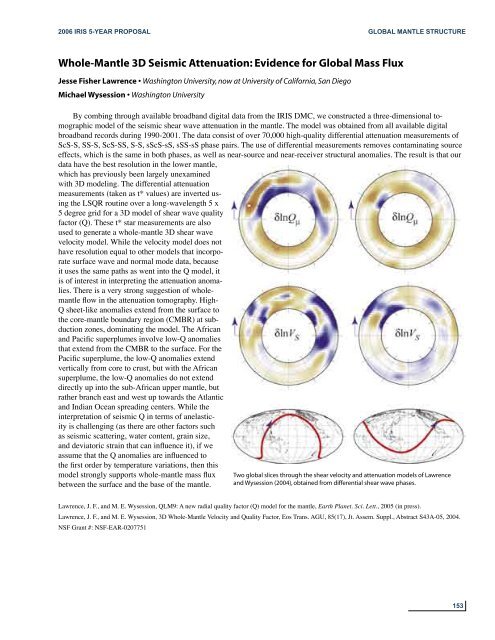
By combing through available broadband digital data from the <strong>IRIS</strong> DMC, we constructed a three-dimensional tomographic<br />
model of the seismic shear wave attenuation in the mantle. The model was obtained from all available digital<br />
broadband records during 1990-2001. The data consist of over 70,000 high-quality differential attenuation measurements of<br />
ScS-S, SS-S, ScS-SS, S-S, sScS-sS, sSS-sS phase pairs. The use of differential measurements removes contaminating source<br />
effects, which is the same in both phases, as well as near-source and near-receiver structural anomalies. The result is that our<br />
data have the best resolution in the lower mantle,<br />
which has previously been largely unexamined<br />
with 3D modeling. The differential attenuation<br />
measurements (taken as t* values) are inverted using<br />
the LSQR routine over a long-wavelength 5 x<br />
5 degree grid for a 3D model of shear wave quality<br />
factor (Q). These t* star measurements are also<br />
used to generate a whole-mantle 3D shear wave<br />
velocity model. While the velocity model does not<br />
have resolution equal to other models that incorporate<br />
surface wave and normal mode data, because<br />
it uses the same paths as went into the Q model, it<br />
is of interest in interpreting the attenuation anomalies.<br />
There is a very strong suggestion of wholemantle<br />
flow in the attenuation tomography. High-<br />
Q sheet-like anomalies extend from the surface to<br />
the core-mantle boundary region (CMBR) at subduction<br />
zones, dominating the model. The African<br />
and Pacific superplumes involve low-Q anomalies<br />
that extend from the CMBR to the surface. For the<br />
Pacific superplume, the low-Q anomalies extend<br />
vertically from core to crust, but with the African<br />
superplume, the low-Q anomalies do not extend<br />
directly up into the sub-African upper mantle, but<br />
rather branch east and west up towards the Atlantic<br />
and Indian Ocean spreading centers. While the<br />
interpretation of seismic Q in terms of anelasticity<br />
is challenging (as there are other factors such<br />
as seismic scattering, water content, grain size,<br />
and deviatoric strain that can influence it), if we<br />
assume that the Q anomalies are influenced to<br />
the first order by temperature variations, then this<br />
model strongly supports whole-mantle mass flux<br />
between the surface and the base of the mantle.<br />
Two global slices through the shear velocity and attenuation models of Lawrence<br />
and Wysession (2004), obtained from differential shear wave phases.<br />
Lawrence, J. F., and M. E. Wysession, QLM9: A new radial quality factor (Q) model for the mantle, Earth Planet. Sci. Lett., 2005 (in press).<br />
Lawrence, J. F., and M. E. Wysession, 3D Whole-Mantle Velocity and Quality Factor, Eos Trans. AGU, 85(17), Jt. Assem. Suppl., Abstract S43A-05, 2004.<br />
NSF Grant #: NSF-EAR-0207751<br />
153


