

NEW_Accomplishments.indd - IRIS
NEW_Accomplishments.indd - IRIS
NEW_Accomplishments.indd - IRIS

You also want an ePaper? Increase the reach of your titles
YUMPU automatically turns print PDFs into web optimized ePapers that Google loves.
2006 <strong>IRIS</strong> 5-YEAR PROPOSAL EDUCATION AND OUTREACH<br />
Seismographs in Schools: Shaking Things Up in the 5th Grade<br />
Jerry Cook • Phoenix Country Day School in Paradise Valley, AZ.<br />
Our school is part of the <strong>IRIS</strong> “Seismographs<br />
in Schools” program. In the beginning<br />
of the school year I explain to the students how<br />
the seismometer works and place a large world<br />
map on the wall of the classroom. The students<br />
quickly start to plot earthquakes on the wall<br />
map. We get our information from the USGS<br />
Web site to plot events. As we plot earthquakes<br />
the kids see right away that they are not located<br />
randomly. In addition, I print a seismogram<br />
for each earthquake and post them on the wall<br />
with the location written on each one. As I post<br />
the recordings the students get a good feel for<br />
how far away the events are. The students do a<br />
good job identifying events as “close”, “across<br />
the big puddle”, or “somewhere in between”.<br />
Close are those events from Arizona, Nevada,<br />
or along the plate boundary from the Sea of<br />
Cortez to Parkfield. The kids recognize these<br />
seismograms as having a relatively small “P”,<br />
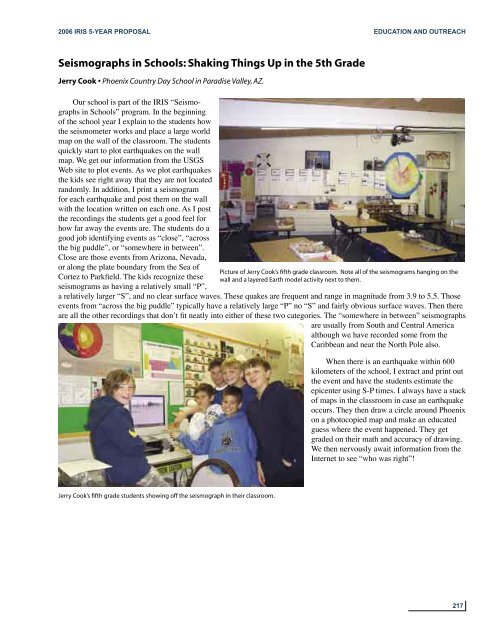
Picture of Jerry Cook’s fifth grade classroom. Note all of the seismograms hanging on the<br />
wall and a layered Earth model activity next to them.<br />
a relatively larger “S”, and no clear surface waves. These quakes are frequent and range in magnitude from 3.9 to 5.5. Those<br />
events from “across the big puddle” typically have a relatively large “P” no “S” and fairly obvious surface waves. Then there<br />
are all the other recordings that donʼt fit neatly into either of these two categories. The “somewhere in between” seismographs<br />
are usually from South and Central America<br />
although we have recorded some from the<br />
Caribbean and near the North Pole also.<br />
When there is an earthquake within 600<br />
kilometers of the school, I extract and print out<br />
the event and have the students estimate the<br />
epicenter using S-P times. I always have a stack<br />
of maps in the classroom in case an earthquake<br />
occurs. They then draw a circle around Phoenix<br />
on a photocopied map and make an educated<br />
guess where the event happened. They get<br />
graded on their math and accuracy of drawing.<br />
We then nervously await information from the<br />
Internet to see “who was right”!<br />
Jerry Cook’s fifth grade students showing off the seismograph in their classroom.<br />
217


