

NEW_Accomplishments.indd - IRIS
NEW_Accomplishments.indd - IRIS
NEW_Accomplishments.indd - IRIS

You also want an ePaper? Increase the reach of your titles
YUMPU automatically turns print PDFs into web optimized ePapers that Google loves.
2006 <strong>IRIS</strong> 5-YEAR PROPOSAL SIGNALS AND SYSTEMS<br />
Earthquake and Ambient Vibration Monitoring of the 17-Story Steel Frame UCLA<br />
Factor Building<br />
Monica Kohler, Paul Davis • University of California, Los Angeles<br />
A unique structural health monitoring program using a 17-story moment-resisting steel frame building with an embedded<br />
72-channel accelerometer array has been implemented on the UCLA campus (Figure 1). The array serves as a prototype for<br />
<br />
data that can be used in predictive modeling of structures for damage assessment and building code modification. The array<br />
records waveforms at 100 and 500 sps. The <strong>IRIS</strong> Data Management Center is archiving the continuous, 100 sps data for the<br />
scientific and engineering community. Nine new digitizers were installed as part of UCLAʼs NSF Science and Technology<br />
Center for Embedded Networked Sensing (CENS) to test embedded network technologies and algorithms with the array.<br />
We have used the data to compute time-varying displacements in 2D (Figure 2, left), the buildingʼs finite impulse<br />
response, and angles of horizontal rotation associated with torsions, and to identify the higher modes of vibration (Figure 2,<br />
right). The observations are being compared with finite element modeling in order to refine the structural model and to perform<br />
predictive motion simulations for scenario earthquakes and nonlinear behavior. Our observations show that measurable<br />
softening effects are occurring for small earthquakes due to changes in the stiffness of the building or soil when amplitudes<br />
get larger (Kohler et al., 2005). For example, the frequency of the first mode of deformation decreases by about 10% but increases<br />
to previous pre-earthquake levels within seconds of the earthquake. Our real-time monitoring program illustrates how<br />
changes in building characteristics can be continuously monitored to detect significant damage or breakage in a structure.<br />
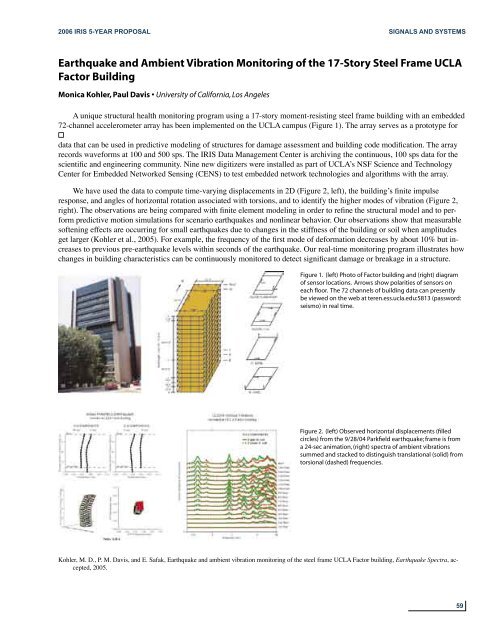
Figure 1. (left) Photo of Factor building and (right) diagram<br />
of sensor locations. Arrows show polarities of sensors on<br />
each floor. The 72 channels of building data can presently<br />
be viewed on the web at teren.ess.ucla.edu:5813 (password:<br />
seismo) in real time.<br />
Figure 2. (left) Observed horizontal displacements (filled<br />
circles) from the 9/28/04 Parkfield earthquake; frame is from<br />
a 24-sec animation, (right) spectra of ambient vibrations<br />
summed and stacked to distinguish translational (solid) from<br />
torsional (dashed) frequencies.<br />
Kohler, M. D., P. M. Davis, and E. Safak, Earthquake and ambient vibration monitoring of the steel frame UCLA Factor building, Earthquake Spectra, accepted,<br />
2005.<br />
59


