

NEW_Accomplishments.indd - IRIS
NEW_Accomplishments.indd - IRIS
NEW_Accomplishments.indd - IRIS

Create successful ePaper yourself
Turn your PDF publications into a flip-book with our unique Google optimized e-Paper software.
2006 <strong>IRIS</strong> 5-YEAR PROPOSAL GLOBAL MANTLE STRUCTURE<br />
Seismic Investigation of Upper and Lower Mantle Boundary Layering<br />
Edward J. Garnero, Nicholas Schmerr, Michael S. Thorne • Arizona State University<br />
Both the upper and lower mantle contain important chemical and dynamical processes that likely govern the evolution<br />
and structure of the whole planet. Our work is focused on seismic methods that help to reveal the present day structure in<br />
the upper and lower mantle. The upper mantle transition zone (TZ) is predicted to change thickness as a function of temperature<br />
and chemistry, thus mapping TZ thickness holds promise as a mantle thermometer (Schmerr and Garnero, 2005). In<br />
the deepest mantle, there is evidence for fine-scale layering with ultra-lowered shear and compressional velocities (Thorne<br />
and Garnero, 2004; Rost et al., 2005). These velocity reductions are restricted to the lowest 5-50 km of the mantle, and are<br />
compatible with a partial melt origin; the ultra-low velocities may relate to deepest mantle plume genesis. At slightly larger<br />
vertical scales, the lowermost 200-300 km show evidence for horizontal layering (Thomas et al., 2004) and seismic anisotropy<br />
(Garnero et al., 2004). The <strong>IRIS</strong> the Data Management System has played a fundamental role in our analyses, as these<br />
studies would not have been possible without it.<br />
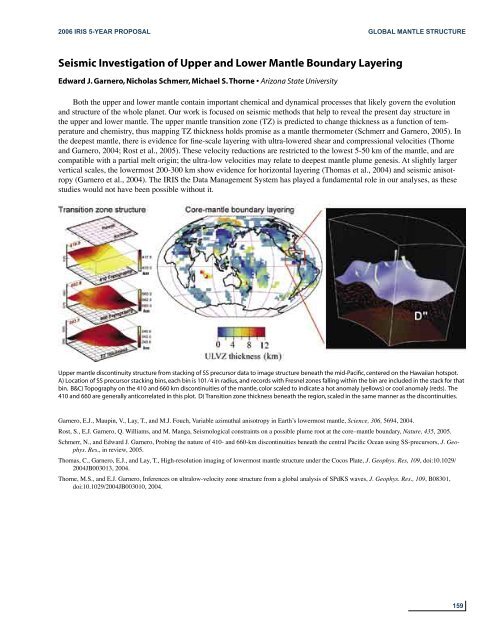
Upper mantle discontinuity structure from stacking of SS precursor data to image structure beneath the mid-Pacific, centered on the Hawaiian hotspot.<br />
A) Location of SS precursor stacking bins, each bin is 101⁄4 in radius, and records with Fresnel zones falling within the bin are included in the stack for that<br />
bin. B&C) Topography on the 410 and 660 km discontinuities of the mantle, color scaled to indicate a hot anomaly (yellows) or cool anomaly (reds). The<br />
410 and 660 are generally anticorrelated in this plot. D) Transition zone thickness beneath the region, scaled in the same manner as the discontinuities.<br />
Garnero, E.J., Maupin, V., Lay, T., and M.J. Fouch, Variable azimuthal anisotropy in Earthʼs lowermost mantle, Science, 306, 5694, 2004.<br />
Rost, S., E.J. Garnero, Q. Williams, and M. Manga, Seismological constraints on a possible plume root at the core–mantle boundary, Nature, 435, 2005.<br />
Schmerr, N., and Edward J. Garnero, Probing the nature of 410- and 660-km discontinuities beneath the central Pacific Ocean using SS-precursors, J. Geophys.<br />
Res., in review, 2005.<br />
Thomas, C., Garnero, E.J., and Lay, T., High-resolution imaging of lowermost mantle structure under the Cocos Plate, J. Geophys. Res, 109, doi:10.1029/<br />
2004JB003013, 2004.<br />
Thorne, M.S., and E.J. Garnero, Inferences on ultralow-velocity zone structure from a global analysis of SPdKS waves, J. Geophys. Res., 109, B08301,<br />
doi:10.1029/2004JB003010, 2004.<br />
159


