

NEW_Accomplishments.indd - IRIS
NEW_Accomplishments.indd - IRIS
NEW_Accomplishments.indd - IRIS

You also want an ePaper? Increase the reach of your titles
YUMPU automatically turns print PDFs into web optimized ePapers that Google loves.
CORE–MANTLE BOUNDARY<br />
2006 <strong>IRIS</strong> 5-YEAR PROPOSAL<br />
A Step in the D” Discontinuity Imaged by Kirchoff Migration Through<br />
3D Tomographic Models<br />
Alex Hutko, Thorne Lay • University of California, Santa Cruz<br />
Justin Revenaugh • University of Minnesota<br />
Ed Garnero • Arizona State University<br />
A simple migration scheme is used to image topography of between 50 and 100 km over less than 200 km laterally of the<br />
D” discontinuity. Correcting for first-order travel-time perturbations based on one-dimensional ray tracing through S-wave tomography<br />
models does not change our interpretation, but does affect the absolute depth of the reflector. The abrupt change in<br />
its height is unlikely to be due to a phase change and temperature differences alone, so chemical heterogeneities are required<br />
to be consistent with the observations.<br />
We also observe<br />
a low-velocity scatterer that<br />
is approximately 2 degrees<br />
in diameter. This feature is<br />
more model dependant but<br />
agrees with finite frequency<br />
tomography results from<br />
Hung et al. (2004). Though<br />
this ray-based method does<br />
not account for bending of<br />
the ray path due to three-dimensional<br />
structure nor does it include scattered energy after the<br />
ray<br />
has reached its turning point, we find it works remarkably well<br />
where data density is sufficient, while having significant gains is<br />
ef-<br />
ficiency over wave equation based methods. In its initial phase, US<br />
Array will have an aperture approximately three times greater than<br />
currently available to study the lower mantle beneath the Americas.<br />
The greater number of crossing rays, which is critical for lower<br />
mantle studies, will undoubtedly lead to further exciting discoveries<br />
and new constraints for other members of the Earth science community.<br />
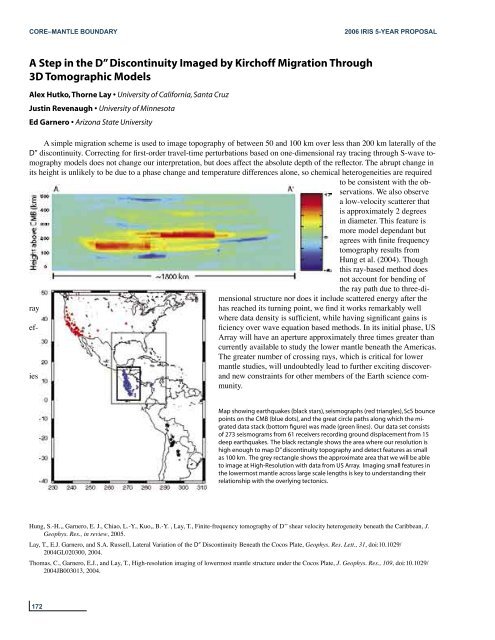
Map showing earthquakes (black stars), seismographs (red triangles), ScS bounce<br />
points on the CMB (blue dots), and the great circle paths along which the migrated<br />
data stack (bottom figure) was made (green lines). Our data set consists<br />
of 273 seismograms from 61 receivers recording ground displacement from 15<br />
deep earthquakes. The black rectangle shows the area where our resolution is<br />
high enough to map D” discontinuity topography and detect features as small<br />
as 100 km. The grey rectangle shows the approximate area that we will be able<br />
to image at High-Resolution with data from US Array. Imaging small features in<br />
the lowermost mantle across large scale lengths is key to understanding their<br />
relationship with the overlying tectonics.<br />
Hung, S.-H.,, Garnero, E. J., Chiao, L.-Y., Kuo,, B.-Y. , Lay, T., Finite-frequency tomography of Dʼʼ shear velocity heterogeneity beneath the Caribbean, J.<br />
Geophys. Res., in review, 2005.<br />
Lay, T., E.J. Garnero, and S.A. Russell, Lateral Variation of the D” Discontinuity Beneath the Cocos Plate, Geophys. Res. Lett., 31, doi:10.1029/<br />
2004GL020300, 2004.<br />
Thomas, C., Garnero, E.J., and Lay, T., High-resolution imaging of lowermost mantle structure under the Cocos Plate, J. Geophys. Res., 109, doi:10.1029/<br />
2004JB003013, 2004.<br />
172


