

NEW_Accomplishments.indd - IRIS
NEW_Accomplishments.indd - IRIS
NEW_Accomplishments.indd - IRIS

You also want an ePaper? Increase the reach of your titles
YUMPU automatically turns print PDFs into web optimized ePapers that Google loves.
2006 <strong>IRIS</strong> 5-YEAR PROPOSAL SURFACE OF THE EARTH: GLOBAL STUDIES<br />
Shear-Wave Splitting Beneath the Eastern Syntaxis Tibetan Experiment<br />
Stéphane Sol, Anne Meltzer, Brian Zurek, Peter Zeitler • Lehigh University<br />
Xuang Zhang, Jianlong Zhang • Institute of Geology and Mineral Resources, China<br />
A dense <strong>IRIS</strong>-PASSCAL passive seismic experiment of 48 broadband and 19 short-period stations was deployed in southeastern<br />
Tibet from July, 2003, to November, 2004. The array is roughly bounded in the south by the Gangdese Thrust system<br />
that runs along the Indus-Yalu suture, and in its north and east margins by the Bangong-Nujiang suture. This experiment has<br />
been designed to answer crucial questions regarding to the geodynamics of the active Indian-Asian collision. One of these key<br />
questions is whether a decoupling zone exists separating the upper crust from the deeper lithosphere. To elucidate this crustmantle<br />
relationship, we performed the SKS and SKKS splitting analysis at all the broadband stations from this array.<br />
While earlier splitting studies have been done in the central part of the plateau using primarily a linear N-S configuration<br />
(McNamara et al., 1994; Sandvol et al., 1997; Huang et al., 2000), our rectangular array should not only confirm changes<br />
when crossing major tectonic boundaries, but also probe the potential lateral (E-W) variations in lithospheric structure. This<br />
E-W station coverage is important because this direction coincides with the direction of the main faults and should permit a<br />
better understanding of the interaction of lateral extrusion with lithospheric deformation.<br />
At a regional scale, the observed splitting pattern does not exhibit a consistent widespread fast direction, ruling out the<br />
presence of anisotropy associated with asthenospheric flow at least as the main component. The most striking feature in this<br />
<br />
of the suture not only when this one is roughly orogen-parallel, but also when the suture undergoes a perceptible change to<br />
S-E around the Eastern syntaxis. This<br />
remarkable southeastward clockwise<br />
rotation of strain around the Himalayan<br />
syntaxis has been previously recognized<br />
at crustal scale from multidisciplinary<br />
studies such as GPS or structural geology.<br />
Another observation is the N-E<br />
fast orientation at the western stations<br />
that appears to be consistent with the<br />
direction of the strike-slip fault that runs<br />
along the eastward Gulu rift. The observed<br />
bulk of anisotropy is contained in<br />
the lithospheric mantle as suggested by<br />
the fair amount of splitting as well as the<br />
Fresnel zone approach. The correlation<br />
between the surface deformation with<br />
the mantle strain directions suggests that<br />
the lower crust should be strong to allow<br />
an effective crust-mantle coupling in<br />
contradiction with some studies in the<br />
central plateau that implied the presence<br />
of a weak lower crust.<br />
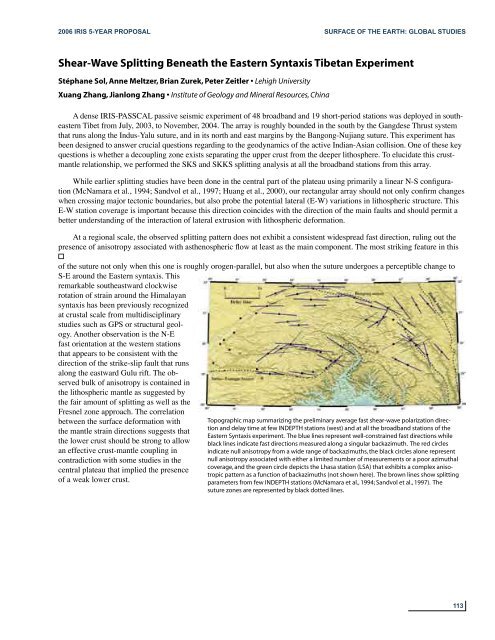
Topographic map summarizing the preliminary average fast shear-wave polarization direction<br />
and delay time at few INDEPTH stations (west) and at all the broadband stations of the<br />
Eastern Syntaxis experiment. The blue lines represent well-constrained fast directions while<br />
black lines indicate fast directions measured along a singular backazimuth. The red circles<br />
indicate null anisotropy from a wide range of backazimuths, the black circles alone represent<br />
null anisotropy associated with either a limited number of measurements or a poor azimuthal<br />
coverage, and the green circle depicts the Lhasa station (LSA) that exhibits a complex anisotropic<br />
pattern as a function of backazimuths (not shown here). The brown lines show splitting<br />
parameters from few INDEPTH stations (McNamara et al., 1994; Sandvol et al., 1997). The<br />
suture zones are represented by black dotted lines.<br />
113


