

NEW_Accomplishments.indd - IRIS
NEW_Accomplishments.indd - IRIS
NEW_Accomplishments.indd - IRIS

You also want an ePaper? Increase the reach of your titles
YUMPU automatically turns print PDFs into web optimized ePapers that Google loves.
GLOBAL MANTLE STRUCTURE<br />
2006 <strong>IRIS</strong> 5-YEAR PROPOSAL<br />
Global Tomographic Model of Q in the Upper Mantle Obtained Using Long-period<br />
Waveform Data<br />
Yuancheng Gung, Barbara Romanowicz • Berkeley Seismological Laboratory<br />
We developed a degree 8 three-dimensional<br />
Q model (QRLW8, Gung and Romanowicz,<br />
2004) of the upper mantle, derived<br />
from three component surface waveform<br />
data in the period range 60-400 sec. These<br />
waveform data were collected from stations<br />
of the <strong>IRIS</strong>/GSN and Geoscope networks.<br />
The inversion procedure involves two steps.<br />
In the first step, 3D whole-mantle velocity<br />
models are derived separately for elastic SH<br />
(transverse component) and SV (vertical and<br />
longitudinal component) velocity models,<br />
using both surface and body waveforms and<br />
the NACT approach (Non-linear asymptotic<br />
coupling theory, Li and Romanowicz, 1995).<br />
In the second step, the surface waveforms<br />
thus aligned in phase are inverted to obtain a<br />
3-D Q model in the depth range 80-670 km.<br />
Various stability tests were performed to<br />
assess the quality of the resulting Q model,<br />
and in particular to assess possible contamination<br />
from focussing effects. We find that<br />
the 3D patterns obtained are stable, but the<br />
amplitude of the lateral variations in Q is not<br />
well constrained, because large damping is<br />
necessary to extract the weak Q signal from<br />
data. The model obtained agrees with previous<br />
results in that a strong correlation of Q<br />
with tectonics is observed in the first 250 km<br />
of the upper mantle, with high attenuation<br />
under oceanic regions and low attenuation<br />
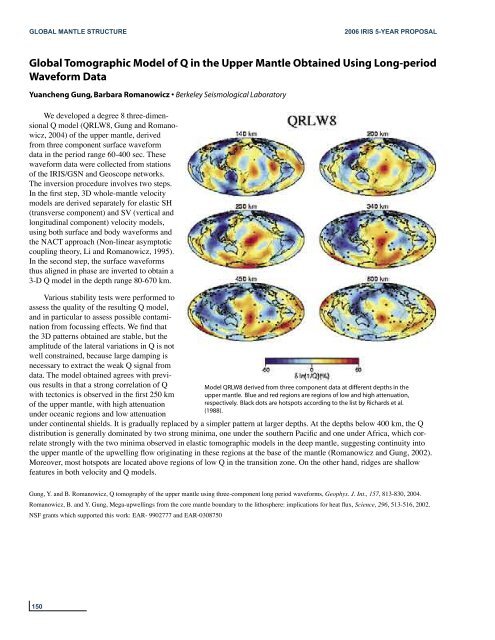
Model QRLW8 derived from three component data at different depths in the<br />
upper mantle. Blue and red regions are regions of low and high attenuation,<br />
respectively. Black dots are hotspots according to the list by Richards et al.<br />
(1988).<br />
under continental shields. It is gradually replaced by a simpler pattern at larger depths. At the depths below 400 km, the Q<br />
distribution is generally dominated by two strong minima, one under the southern Pacific and one under Africa, which correlate<br />
strongly with the two minima observed in elastic tomographic models in the deep mantle, suggesting continuity into<br />
the upper mantle of the upwelling flow originating in these regions at the base of the mantle (Romanowicz and Gung, 2002).<br />
Moreover, most hotspots are located above regions of low Q in the transition zone. On the other hand, ridges are shallow<br />
features in both velocity and Q models.<br />
Gung, Y. and B. Romanowicz, Q tomography of the upper mantle using three-component long period waveforms, Geophys. J. Int., 157, 813-830, 2004.<br />
Romanowicz, B. and Y. Gung, Mega-upwellings from the core mantle boundary to the lithosphere: implications for heat flux, Science, 296, 513-516, 2002.<br />
NSF grants which supported this work: EAR- 9902777 and EAR-0308750<br />
150


