

NEW_Accomplishments.indd - IRIS
NEW_Accomplishments.indd - IRIS
NEW_Accomplishments.indd - IRIS

You also want an ePaper? Increase the reach of your titles
YUMPU automatically turns print PDFs into web optimized ePapers that Google loves.
2006 <strong>IRIS</strong> 5-YEAR PROPOSAL SURFACE OF THE EARTH: NORTH AMERICA<br />
Crustal Structure of the Basin and Range, Colorado Plateau, Rocky Mountains,<br />
and Great Plains<br />
Hersh Gilbert • University of Arizona<br />
Anne Sheehan • University of Colorado at Boulder<br />
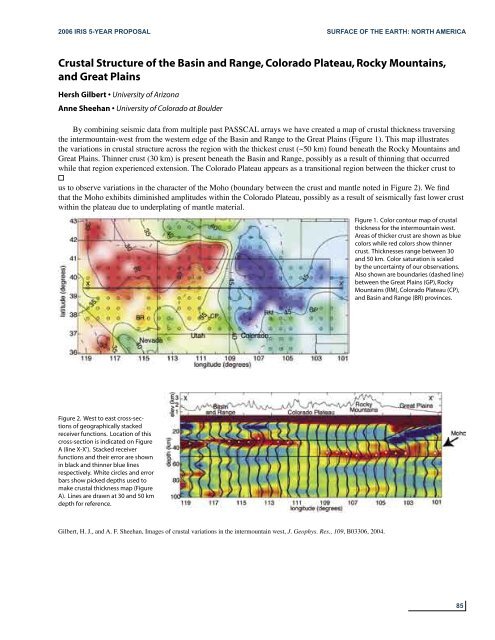
By combining seismic data from multiple past PASSCAL arrays we have created a map of crustal thickness traversing<br />
the intermountain-west from the western edge of the Basin and Range to the Great Plains (Figure 1). This map illustrates<br />
the variations in crustal structure across the region with the thickest crust (~50 km) found beneath the Rocky Mountains and<br />
Great Plains. Thinner crust (30 km) is present beneath the Basin and Range, possibly as a result of thinning that occurred<br />
while that region experienced extension. The Colorado Plateau appears as a transitional region between the thicker crust to<br />
<br />
us to observe variations in the character of the Moho (boundary between the crust and mantle noted in Figure 2). We find<br />
that the Moho exhibits diminished amplitudes within the Colorado Plateau, possibly as a result of seismically fast lower crust<br />
within the plateau due to underplating of mantle material.<br />
Figure 1. Color contour map of crustal<br />
thickness for the intermountain west.<br />
Areas of thicker crust are shown as blue<br />
colors while red colors show thinner<br />
crust. Thicknesses range between 30<br />
and 50 km. Color saturation is scaled<br />
by the uncertainty of our observations.<br />
Also shown are boundaries (dashed line)<br />
between the Great Plains (GP), Rocky<br />
Mountains (RM), Colorado Plateau (CP),<br />
and Basin and Range (BR) provinces.<br />
Figure 2. West to east cross-sections<br />
of geographically stacked<br />
receiver functions. Location of this<br />
cross-section is indicated on Figure<br />
A (line X-X’). Stacked receiver<br />
functions and their error are shown<br />
in black and thinner blue lines<br />
respectively. White circles and error<br />
bars show picked depths used to<br />
make crustal thickness map (Figure<br />
A). Lines are drawn at 30 and 50 km<br />
depth for reference.<br />
Gilbert, H. J., and A. F. Sheehan, Images of crustal variations in the intermountain west, J. Geophys. Res., 109, B03306, 2004.<br />
85


