Essays on supplier responsiveness and buyer firm value - Nyenrode ...
Essays on supplier responsiveness and buyer firm value - Nyenrode ...
Essays on supplier responsiveness and buyer firm value - Nyenrode ...

Create successful ePaper yourself
Turn your PDF publications into a flip-book with our unique Google optimized e-Paper software.
some resp<strong>on</strong>dents would not provide their company name; instead, they typed in r<strong>and</strong>om letters or<br />
scant informati<strong>on</strong> regarding their line of business. Therefore, such resp<strong>on</strong>ses were discarded. We used<br />
the list wise deleti<strong>on</strong> method which involves selecting those cases that were incompletely filled.<br />
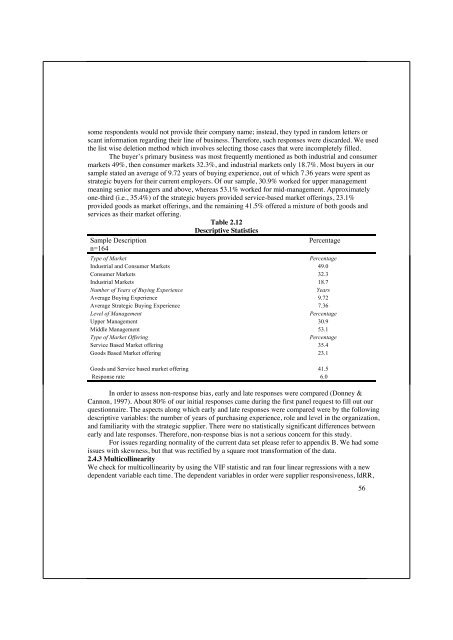
The <strong>buyer</strong>’s primary business was most frequently menti<strong>on</strong>ed as both industrial <strong>and</strong> c<strong>on</strong>sumer<br />
markets 49%, then c<strong>on</strong>sumer markets 32.3%, <strong>and</strong> industrial markets <strong>on</strong>ly 18.7%. Most <strong>buyer</strong>s in our<br />
sample stated an average of 9.72 years of buying experience, out of which 7.36 years were spent as<br />
strategic <strong>buyer</strong>s for their current employers. Of our sample, 30.9% worked for upper management<br />
meaning senior managers <strong>and</strong> above, whereas 53.1% worked for mid-management. Approximately<br />
<strong>on</strong>e-third (i.e., 35.4%) of the strategic <strong>buyer</strong>s provided service-based market offerings, 23.1%<br />
provided goods as market offerings, <strong>and</strong> the remaining 41.5% offered a mixture of both goods <strong>and</strong><br />
services as their market offering.<br />
Table 2.12<br />
Descriptive Statistics<br />
Sample Descripti<strong>on</strong><br />
Percentage<br />
n=164<br />
Type of Market<br />
Percentage<br />
Industrial <strong>and</strong> C<strong>on</strong>sumer Markets 49.0<br />
C<strong>on</strong>sumer Markets 32.3<br />
Industrial Markets 18.7<br />
Number of Years of Buying Experience<br />
Years<br />
Average Buying Experience 9.72<br />
Average Strategic Buying Experience 7.36<br />
Level of Management<br />
Percentage<br />
Upper Management 30.9<br />
Middle Management 53.1<br />
Type of Market Offering<br />
Percentage<br />
Service Based Market offering 35.4<br />
Goods Based Market offering 23.1<br />
Goods <strong>and</strong> Service based market offering 41.5<br />
Resp<strong>on</strong>se rate 6.0<br />
In order to assess n<strong>on</strong>-resp<strong>on</strong>se bias, early <strong>and</strong> late resp<strong>on</strong>ses were compared (D<strong>on</strong>ney &<br />
Cann<strong>on</strong>, 1997). About 80% of our initial resp<strong>on</strong>ses came during the first panel request to fill out our<br />
questi<strong>on</strong>naire. The aspects al<strong>on</strong>g which early <strong>and</strong> late resp<strong>on</strong>ses were compared were by the following<br />
descriptive variables: the number of years of purchasing experience, role <strong>and</strong> level in the organizati<strong>on</strong>,<br />
<strong>and</strong> familiarity with the strategic <strong>supplier</strong>. There were no statistically significant differences between<br />
early <strong>and</strong> late resp<strong>on</strong>ses. Therefore, n<strong>on</strong>-resp<strong>on</strong>se bias is not a serious c<strong>on</strong>cern for this study.<br />
For issues regarding normality of the current data set please refer to appendix B. We had some<br />
issues with skewness, but that was rectified by a square root transformati<strong>on</strong> of the data.<br />
2.4.3 Multicollinearity<br />
We check for multicollinearity by using the VIF statistic <strong>and</strong> ran four linear regressi<strong>on</strong>s with a new<br />
dependent variable each time. The dependent variables in order were <strong>supplier</strong> resp<strong>on</strong>siveness, IdRR,<br />
56