- Page 2 and 3:
PREFACE Manufacturing and workshop
- Page 4 and 5:
1 CHAPTER INTRODUCTION 1.1 INTRODUC
- Page 6 and 7:
Introduction 3 material into finish
- Page 8 and 9:
1.7.3 Metal Forming Processes Intro
- Page 10 and 11:
Introduction 7 security procedures
- Page 12 and 13:
Introduction 9 FMS and Computer Int
- Page 14 and 15:
Introduction 11 towards economic an
- Page 16 and 17:
Introduction 13 capabilities of the
- Page 18 and 19:
Introduction 15 particular applicat
- Page 20 and 21:
2 CHAPTER PLANT AND SHOP LAYOUT 2.1
- Page 22 and 23:
Plant and Shop Layout 19 5. Working
- Page 24 and 25:
Plant and Shop Layout 21 according
- Page 26 and 27:
Plant and Shop Layout 23 5. Better
- Page 28:
Plant and Shop Layout 25 7. Machine
- Page 31 and 32:
28 Introduction to Basic Manufactur
- Page 33 and 34:
30 Introduction to Basic Manufactur
- Page 35 and 36:
32 Introduction to Basic Manufactur
- Page 37 and 38:
34 Introduction to Basic Manufactur
- Page 39 and 40:
36 Introduction to Basic Manufactur
- Page 41 and 42:
38 Introduction to Basic Manufactur
- Page 43 and 44:
40 Introduction to Basic Manufactur
- Page 45 and 46:
42 Introduction to Basic Manufactur
- Page 47 and 48:
44 Introduction to Basic Manufactur
- Page 49 and 50:
46 Introduction to Basic Manufactur
- Page 51 and 52:
48 Introduction to Basic Manufactur
- Page 53 and 54:
50 Introduction to Basic Manufactur
- Page 55 and 56:
52 Introduction to Basic Manufactur
- Page 57 and 58:
54 Introduction to Basic Manufactur
- Page 59 and 60:
56 Introduction to Basic Manufactur
- Page 61 and 62:
58 Introduction to Basic Manufactur
- Page 63 and 64:
60 Introduction to Basic Manufactur
- Page 65 and 66:
62 Introduction to Basic Manufactur
- Page 67 and 68:
64 Introduction to Basic Manufactur
- Page 69 and 70:
66 Introduction to Basic Manufactur
- Page 71 and 72:
68 Introduction to Basic Manufactur
- Page 73 and 74:
70 Introduction to Basic Manufactur
- Page 75 and 76:
72 Introduction to Basic Manufactur
- Page 77 and 78:
74 Introduction to Basic Manufactur
- Page 80 and 81: Non-Ferrous Materials 77 impurities
- Page 82 and 83: Non-Ferrous Materials 79 It is made
- Page 84 and 85: Applications Non-Ferrous Materials
- Page 86 and 87: Non-Ferrous Materials 83 5.3.1.8 Gi
- Page 88 and 89: Non-Ferrous Materials 85 springs, h
- Page 90 and 91: 5.4.2 Nickel Alloys Non-Ferrous Mat
- Page 92 and 93: 5.5 LEAD Non-Ferrous Materials 89 L
- Page 94 and 95: Applications Non-Ferrous Materials
- Page 96 and 97: Non-Ferrous Materials 93 (iv) (v) C
- Page 98 and 99: Non-Ferrous Materials 95 produced i
- Page 100 and 101: Non-Ferrous Materials 97 polymers,
- Page 102 and 103: Non-Ferrous Materials 99 vessel mat
- Page 104 and 105: Binocular Body Non-Ferrous Material
- Page 106 and 107: Melting Furnaces 103 2. Steel (a) E
- Page 108 and 109: Melting Furnaces 105 Blower Stove B
- Page 110 and 111: 1. Well Melting Furnaces 107 The sp
- Page 112 and 113: Melting Furnaces 109 operations. In
- Page 114 and 115: Melting Furnaces 111 The chemical c
- Page 116 and 117: Melting Furnaces 113 Firing Door Fi
- Page 118 and 119: Melting Furnaces 115 20 What is ref
- Page 120 and 121: 4. Specific Gravity Porperties and
- Page 122 and 123: Porperties and Testing of Metals 11
- Page 124 and 125: 12. Creep Porperties and Testing of
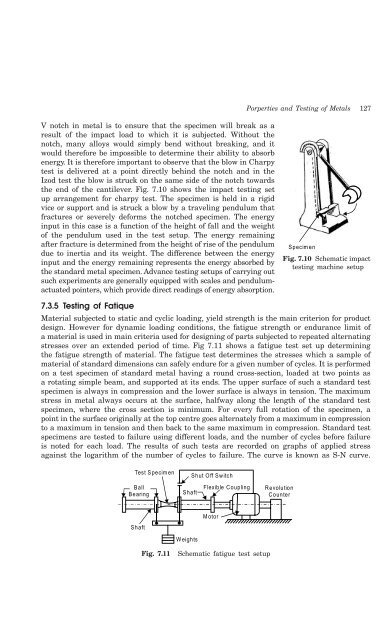
- Page 126 and 127: Porperties and Testing of Metals 12
- Page 128 and 129: Porperties and Testing of Metals 12
- Page 132 and 133: 7.5 QUESTIONS Porperties and Testin
- Page 134 and 135: Heat Treatment 131 (b) Movable type
- Page 136 and 137: Heat Treatment 133 steels, in iron
- Page 138 and 139: 8.6.1.2 Ferrite Heat Treatment 135
- Page 140 and 141: Heat Treatment 137 1. Normalizing 2
- Page 142 and 143: Annealing is of two types (a) (b) P
- Page 144 and 145: Heat Treatment 141 Sudden cooling o
- Page 146 and 147: Heat Treatment 143 of temperature a
- Page 148 and 149: Advantages of Aus-Tempering Heat Tr
- Page 150 and 151: Heat Treatment 147 carbon steel is
- Page 152 and 153: Heat Treatment 149 In the induction
- Page 154 and 155: Heat Treatment 151 6. Write short n
- Page 156 and 157: Carpentry 153 heartwood, sapwood, p
- Page 158 and 159: Carpentry 155 The proper time of cu
- Page 160 and 161: Carpentry 157 9.5 DEFECTS IN TIMBER
- Page 162 and 163: 9.8 FACTORS INFLUENCING TIMBER SELE
- Page 164 and 165: Albumen glue Carpentry 161 It is pr
- Page 166 and 167: Carpentry 163 The steel blade and m
- Page 168 and 169: Carpentry 165 Jaw Clamp Trigger for
- Page 170 and 171: Crosscut Saw Carpentry 167 Cross cu
- Page 172 and 173: Jointer Plane Carpentry 169 When a
- Page 174 and 175: Carpentry 171 pattern making and wh
- Page 176 and 177: Forstner bits These are used for bo
- Page 178 and 179: Pincer Carpentry 175 Pincers are co
- Page 180 and 181:
Carpentry 177 2. Circular Saw A cir
- Page 182 and 183:
10 CHAPTER PATTERN AND CORE MAKING
- Page 184 and 185:
Pattern and Core Making 181 quality
- Page 186 and 187:
Pattern and Core Making 183 Disadva
- Page 188 and 189:
3. Cope and drag pattern Pattern an
- Page 190 and 191:
Pattern and Core Making 187 11. Seg
- Page 192 and 193:
Pattern and Core Making 189 density
- Page 194 and 195:
Pattern and Core Making 191 Core bo
- Page 196 and 197:
5. Back saw 6. Panel saw 7. Miter s
- Page 198 and 199:
Pattern and Core Making 195 16. Pro
- Page 200 and 201:
11 CHAPTER FOUNDRY TOOLS AND EQUIPM
- Page 202 and 203:
Strike off bar Foundry Tools and Eq
- Page 204 and 205:
Foundry Tools and Equipments 201 Fi
- Page 206 and 207:
Foundry Tools and Equipments 203 re
- Page 208 and 209:
11.4.2 Classification of Moulding M
- Page 210 and 211:
Foundry Tools and Equipments 207 5.
- Page 212 and 213:
12.3 CONSTITUENTS OF MOLDING SAND M
- Page 214 and 215:
Mold and Core Making 211 some speci
- Page 216 and 217:
12.4.7 Parting sand Mold and Core M
- Page 218 and 219:
Mold and Core Making 215 increased
- Page 220 and 221:
12.6. 5 Strength Test Mold and Core
- Page 222 and 223:
Mold and Core Making 219 Balanced t
- Page 224 and 225:
Mold and Core Making 221 mixture we
- Page 226 and 227:
Mold and Core Making 223 Molding sa
- Page 228 and 229:
5. Runner Mold and Core Making 225
- Page 230 and 231:
12.12 ROLE OF RISER IN SAND CASTING
- Page 232 and 233:
12.15 CORE SAND Mold and Core Makin
- Page 234 and 235:
12.16.2.2 Core ramming machines Mol
- Page 236 and 237:
12.20.1 Bench Molding Mold and Core
- Page 238 and 239:
Mold and Core Making 235 This hard
- Page 240 and 241:
Mold and Core Making 237 Stirrer Pl
- Page 242 and 243:
Mold and Core Making 239 11. What i
- Page 244 and 245:
13 CHAPTER CASTING 13.1 INTRODUNCTI
- Page 246 and 247:
Casting 243 gravity only and no ext
- Page 248 and 249:
Casting 245 (iv) (v) Opening the di
- Page 250 and 251:
Casting 247 Applications 1. Carbure
- Page 252 and 253:
Casting 249 containing a mixture of
- Page 254 and 255:
Semi-Centrifugal Casting Casting 25
- Page 256 and 257:
Casting 253 Table 13.1: Probable Ca
- Page 258 and 259:
16. Swells 1. Too soft ramming of m
- Page 260 and 261:
13.12 QUESTIONS Casting 257 1. Desc
- Page 262 and 263:
51. Explain the causes and remedies
- Page 264 and 265:
Advantages of forging Some common a
- Page 266 and 267:
Forging 263 on it. Forgeable metals
- Page 268 and 269:
14.4.6 Open fire and stock fire fur
- Page 270 and 271:
Forging 267 10. The place of the me
- Page 272 and 273:
Forging 269 pickling in acid, shot
- Page 274 and 275:
Hand hammers Forging 271 There are
- Page 276 and 277:
Shovel Forging 273 Shovel generally
- Page 278 and 279:
Forging 275 opposite to drawing and
- Page 280 and 281:
Forging 277 Spring hammers may be m
- Page 282 and 283:
14.12 REMOVAL OF DEFECTS IN FORGING
- Page 284 and 285:
Forging 281 7. Pneumatic riveting m
- Page 286 and 287:
Hot Working of Metals 283 between a
- Page 288 and 289:
Hot Working of Metals 285 4. Porosi
- Page 290 and 291:
Hot Working of Metals 287 type of t
- Page 292 and 293:
Hot Working of Metals 289 Hot pirci
- Page 294 and 295:
Hot Working of Metals 291 the punch
- Page 296 and 297:
16 CHAPTER COLD WORKING 16.1 INTROD
- Page 298 and 299:
16.5 ADVANTAGES OF COLD WORKING Col
- Page 300 and 301:
Cold Working 297 Cold working proce
- Page 302 and 303:
Cold Working 299 steels are used in
- Page 304 and 305:
Cold Working 301 seaming and spinni
- Page 306 and 307:
Cold Working 303 Each section must
- Page 308 and 309:
Cold Working 305 12. What is impact
- Page 310 and 311:
Welding 307 Toe Fusion zone Weld fa
- Page 312 and 313:
Welding 309 2. Horizontal position
- Page 314 and 315:
Welding 311 5. Gas Metal Arc Weldin
- Page 316 and 317:
Welding 313 2. Carburizing welding
- Page 318 and 319:
Welding 315 could occur if the cyli
- Page 320 and 321:
Welding 317 8. For repairs, calibra
- Page 322 and 323:
Welding 319 mains electricity suppl
- Page 324 and 325:
Welding 321 6. Chipping hammer Chip
- Page 326 and 327:
Welding 323 2. Shielded metal arc w
- Page 328 and 329:
Electric power source Welding 325 B
- Page 330 and 331:
Welding 327 13. Welders and workers
- Page 332 and 333:
Welding 329 Where H = heat generate
- Page 334 and 335:
17.7.1.2 Resistance Seam Welding We
- Page 336 and 337:
Welding 333 5. Surface of the jobs
- Page 338 and 339:
17.8.3 Explosive Welding Welding 33
- Page 340 and 341:
Welding 337 be scattered. This scat
- Page 342 and 343:
Welding 339 Porosity Fig. 17.31(iii
- Page 344 and 345:
Welding 341 (b) (c) Bad welding tec
- Page 346 and 347:
Welding 343 exceeding 450°C and be
- Page 348 and 349:
Welding 345 7. What effect does wel
- Page 350 and 351:
Welding 347 (i) Spot welding (ii) S
- Page 352 and 353:
1. Black Iron Sheet Sheet Metal Wor
- Page 354 and 355:
Sheet Metal Work 351 (g) Bossing ma
- Page 356 and 357:
Sheet Metal Work 353 10. Blow horn
- Page 358 and 359:
Sheet Metal Work 355 4. Trammel. Fi
- Page 360 and 361:
Sheet Metal Work 357 18.4 FOLDING T
- Page 362 and 363:
Sheet Metal Work 359 4. Hem (single
- Page 364 and 365:
Sheet Metal Work 361 moveable. When
- Page 366 and 367:
Sheet Metal Work 363 4. Blanking. I
- Page 368 and 369:
Fitting 365 scriber, semi-circular
- Page 370 and 371:
9. Miscellaneous Tools Fitting 367
- Page 372 and 373:
19.2.1.11 Surface Gauge or Scribing
- Page 374 and 375:
Fitting 371 machined true to keep t
- Page 376 and 377:
Fitting 373 the thimble the spindle
- Page 378 and 379:
19.2.3.3 Caliper Fitting 375 Calipe
- Page 380 and 381:
0 .44 1.5 Fitting 377 12mm 0 5 1015
- Page 382 and 383:
Fitting 379 Scriber Spirit-level Sq
- Page 384 and 385:
Fitting 381 4. Ring gauge 5. Snap g
- Page 386 and 387:
19.2.4.1.3 Universal swivel base ma
- Page 388 and 389:
Fitting 385 (A) Type of Cut The mos
- Page 390 and 391:
Fitting 387 1. Hand file 2. Flat fi
- Page 392 and 393:
Fitting 389 Hand drill Pneumatic dr
- Page 394 and 395:
S h a n k D ia Fitting 391 in Fig.
- Page 396 and 397:
19.2.7.1 Pliers Fitting 393 Pliers
- Page 398 and 399:
Fitting 395 graded from fine to coa
- Page 400 and 401:
20 CHAPTER METAL CUTTING 20.1 INTRO
- Page 402 and 403:
Metal Cutting 399 turning, facing a
- Page 404 and 405:
(vii) Nose radius Metal Cutting 401
- Page 406 and 407:
Metal Cutting 403 Continuous chip D
- Page 408 and 409:
Metal Cutting 405 20.7 QUESTIONS 1.
- Page 410 and 411:
Lathe Machine 407 2. Centre or engi
- Page 412 and 413:
Lathe Machine 409 1. Bed 2. Head st
- Page 414 and 415:
Lathe Machine 411 1. End of bed gea
- Page 416 and 417:
Lathe Machine 413 It is rotated by
- Page 418 and 419:
Lathe Machine 415 (b) Operations wh
- Page 420 and 421:
Lathe Machine 417 Job Feed lever To
- Page 422 and 423:
Lathe Machine 419 longitudinal and
- Page 424 and 425:
Lathe Machine 421 22.12 QUESTIONS 1
- Page 426 and 427:
Drilling Machine 423 5. Feed handle
- Page 428 and 429:
Drilling Machine 425 feeding the dr
- Page 430 and 431:
Number sizes Drilling Machine 427 I
- Page 432 and 433:
Drilling Machine 429 the main cutti
- Page 434 and 435:
Drilling Machine 431 22.5.4 Counter
- Page 436 and 437:
22.7 CUTTING SPEED Drilling Machine
- Page 438 and 439:
Shaper, Planer and Slotter 435 take
- Page 440 and 441:
Shaper, Planer and Slotter 437 the
- Page 442 and 443:
Shaper, Planer and Slotter 439 work
- Page 444 and 445:
23.8 SHAPER OPERATIONS Shaper, Plan
- Page 446 and 447:
Shaper, Planer and Slotter 443 a st
- Page 448 and 449:
Shaper, Planer and Slotter 445 Ram
- Page 450 and 451:
24 CHAPTER MILLING 24.1 INTRODUCTIO
- Page 452 and 453:
24.4 TYPES OF MILLING CUTTERS Milli
- Page 454 and 455:
Milling 451 2. Planer milling machi
- Page 456 and 457:
Front brace Milling 453 It is an ex
- Page 458 and 459:
Face milling Milling 455 Fig. 24.9(
- Page 460 and 461:
Milling 457 A B Straddle milling (m
- Page 462 and 463:
25.2.1 Production of Metal Powders
- Page 464 and 465:
Particle shape Powder Metallurgy 46
- Page 466 and 467:
Powder Metallurgy 463 3. The dimens
- Page 468 and 469:
25.6 QUESTIONS Powder Metallurgy 46
- Page 470 and 471:
Inspection and Quality Control 467
- Page 472 and 473:
26.3.7 Fundamental Deviation Inspec
- Page 474 and 475:
Inspection and Quality Control 471
- Page 476 and 477:
Inspection and Quality Control 473
- Page 478 and 479:
INDEX A A feeler gauge 381 Abrasive
- Page 480 and 481:
Index 477 Cartridge brass 81 Case h
- Page 482 and 483:
Index 479 Core sand preparation 230
- Page 484 and 485:
Index 481 First aid 30, 39, 41, 49,
- Page 486 and 487:
Index 483 High speed steels 62, 66,
- Page 488 and 489:
Index 485 Mechanical properties 116
- Page 490 and 491:
Index 487 Pattern construction 195
- Page 492 and 493:
Index 489 Role of riser 227 Roll fo
- Page 494 and 495:
Index 491 Surface cleaning process
- Page 496:
Index 493 W Water seasoning 156 Wax