the Labour Market Survey Report - Council of European ...
the Labour Market Survey Report - Council of European ...
the Labour Market Survey Report - Council of European ...

You also want an ePaper? Increase the reach of your titles
YUMPU automatically turns print PDFs into web optimized ePapers that Google loves.
life and work, including <strong>the</strong> emergence <strong>of</strong> a growing number <strong>of</strong> s<strong>of</strong>tware systems governing “safetycritical”<br />
operations, it is possible that this may become an issue in <strong>the</strong> future. In view <strong>of</strong> <strong>the</strong> differences<br />
between national education and training systems for IT Pr<strong>of</strong>essionals, <strong>the</strong>re could indeed be challenges<br />
<strong>of</strong> rationalisation, and it may be that <strong>the</strong> significant take-up <strong>of</strong> proprietary qualifications internationally<br />
will result in <strong>the</strong> emergence <strong>of</strong> international standards (even, perhaps, passports?) drawing on <strong>the</strong>se.<br />
These considerations are also on <strong>the</strong> agenda <strong>of</strong> <strong>the</strong> World Trade Organisation, whose working group on<br />
pr<strong>of</strong>essional services is addressing barriers to mobility between countries beyond <strong>the</strong> EU.<br />
Receiving<br />
Country<br />
Austria<br />
Belgium<br />
Denmark<br />
Finland<br />
France<br />
Nationality<br />
Austria - 0.9 1.8 1.4 1.3 7.0 3.2 4.0 1.7 0.7 1.6 1.1 1.2<br />
Belgium 1.2 - 1.7 1.1 6.4 1.3 3.0 16.7 9.6 4.6 6.5 0.9 0.8<br />
Denmark 1.5 1.6 - 4.9 1.4 1.7 4.0 2.0 1.9 1.2 1.7 14.3 2.0<br />
Finland 2.1 1.5 5.0 - 0.9 2.1 3.0 1.5 2.1 1.0 2.5 39.7 4.6<br />
France 5.6 25.5 9.6 6.4 - 9.5 11.6 23.4 9.4 12.2 13.6 5.0 33.9<br />
Germany 51.1 11.3 20.4 10.4 9.9 - 26.4 9.5 25.6 23.0 29.1 13.3 12.7<br />
Greece 4.2 2.2 1.1 1.9 1.2 11.0 - 1.1 3.5 0.1 0.2 2.8 14.7<br />
Ireland 1.0 1.2 1.9 0.9 2.1 2.6 1.0 1.1 3.2 1.3 0.8 1.6 2.3<br />
Italy 11.0 10.0 6.7 4.2 13.8 26.2 8.7 6.9 6.6 6.1 10.1 2.8 4.3<br />
Luxembourg 0.1 0.8 - 0.0 0.2 0.4 0.1 - 0.1 0.1 0.1 0.1 -<br />
Ne<strong>the</strong>rlands 4.4 22.8 8.0 3.8 3.4 4.7 7.0 3.6 - 10.8 5.5 3.8 7.7<br />
Portugal 4.5 5.9 1.0 0.3 36.4 17.7 0.4 25.9 3.4 - 6.9 0.7 3.5<br />
Spain 2.3 4.2 6.2 3.6 8.1 4.9 0.9 1.8 5.6 17.1 - 2.2 5.3<br />
Sweden 3.5 2.3 18.9 48.3 2.2 2.4 5.8 1.9 2.8 2.2 2.3 - 7.1<br />
United Kingdom 7.5 9.8 17.6 12.8 12.7 8.5 24.9 4.2 24.4 19.7 19.1 11.7 -<br />
TOTAL 100 100 100 100 100 100 100 100 100 100 100 100 100<br />
In percent <strong>of</strong> total<br />
inflows <strong>of</strong><br />
20.2 56.0 27.6 17.0 9.7 24.5 17.5 78.3 25.0 59.0 39.1 21.4 32.3<br />
foreigners<br />
Share <strong>of</strong> EU citizens<br />
in total population<br />
1.1 4.7 0.8 0.2 2.0 2.3 0.2 30.0 1.4 0.3 0.3 2.1 1.4<br />
Germany<br />
Greece<br />
Luxembourg<br />
Ne<strong>the</strong>rlands<br />
Portugal<br />
Spain<br />
Sweden<br />
U.K.<br />
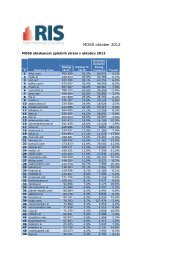
Table 4<br />
Immigration Flows (all occupations) by nationality in per cent <strong>of</strong> total inflows <strong>of</strong> EU citizens (1997)<br />
Source: Eurostat, New Cronos database (no data available for arrivals in Italy or Ireland)<br />
70<br />
| C E P I S I.T. PRACTITIONER SKILLS IN EUROPE | Section 4