the Labour Market Survey Report - Council of European ...
the Labour Market Survey Report - Council of European ...
the Labour Market Survey Report - Council of European ...

Create successful ePaper yourself
Turn your PDF publications into a flip-book with our unique Google optimized e-Paper software.
c) The approach taken in this study is <strong>the</strong>refore to investigate future demand by exploring scenarios<br />
<strong>of</strong> <strong>the</strong> development <strong>of</strong> employment levels from <strong>the</strong> most recent figures available from <strong>of</strong>ficial<br />
statistics. This will be done making certain very broad assumptions about <strong>the</strong> development <strong>of</strong><br />
overall economic activity, but will also explore several scenarios, in recognition that a single<br />
projection produces unmerited implicit confidence in a particular future that is not supported<br />
by any evidence. There is a considerable body <strong>of</strong> knowledge surrounding scenario analysis.<br />
Often forecasting analyses draw on two or three scenarios. This study uses four scenarios, since<br />
two scenarios can misleadingly give <strong>the</strong> impression that <strong>the</strong> future will definitely lie somewhere<br />
between <strong>the</strong> two, and three scenarios generally produce <strong>the</strong> instinctive response <strong>of</strong> selecting<br />
<strong>the</strong> “middle” course, which is <strong>the</strong>reby given undue credibility as a “compromise”. With four<br />
scenarios, <strong>the</strong> reader recognizes that <strong>the</strong>re could be more and thus none <strong>of</strong> <strong>the</strong> scenarios will<br />
actually come to pass, and <strong>the</strong> absence <strong>of</strong> “one in <strong>the</strong> middle” streng<strong>the</strong>ns <strong>the</strong> recognition <strong>of</strong><br />
many possibilities (technically, <strong>the</strong>se are employment growth possibilities, ra<strong>the</strong>r than “real”<br />
scenarios).<br />
d) The scenario developments adopted for this study are shown in Figure 19. As can be seen,<br />
<strong>the</strong>re is an initial dip in <strong>the</strong> development reflecting <strong>the</strong> recent fall in confidence in <strong>the</strong> relevant<br />
economies generally and IT activity in particular, including a series <strong>of</strong> lay-<strong>of</strong>fs <strong>of</strong> high tech<br />
staff*. The four scenarios involve annual employment growth rates <strong>of</strong> 2%, 5% 10% and 15%<br />
respectively, superimposed on a “trough” characteristic represented by a ‘sinusoidal’ waveform.<br />
This has been chosen as a relatively good way <strong>of</strong> achieving a smooth dip, and fulfils <strong>the</strong> following<br />
constraints:<br />
• There is an initial peak (to enable a smooth “point <strong>of</strong> inflection” transition to a fall)<br />
• The trough “hits its lowest point” around <strong>the</strong> end <strong>of</strong> 2002<br />
• The “trough” component disappears once <strong>the</strong> curve has returned to <strong>the</strong> initial peak level<br />
(since this cyclical component is too “short” - for a “real business cycle” - for it to produce<br />
fur<strong>the</strong>r influence once a real pick-up has been achieved)<br />
As can be seen from Figure 19, <strong>the</strong> combination <strong>of</strong> <strong>the</strong> steady growth and <strong>the</strong> trough component<br />
produces troughs <strong>of</strong> different intensity and lowest-point-timing depending on <strong>the</strong> underlying<br />
growth rate.<br />
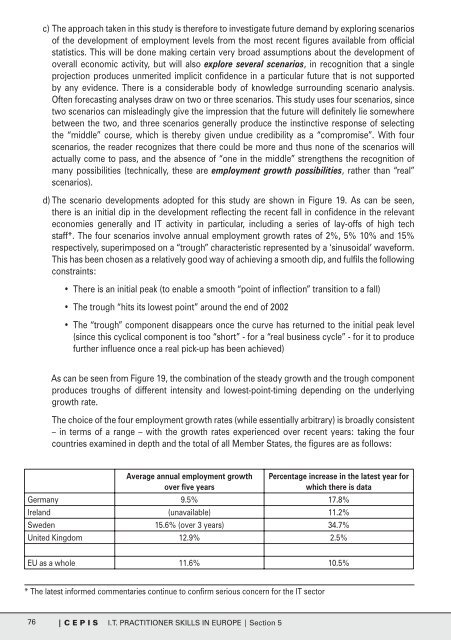
The choice <strong>of</strong> <strong>the</strong> four employment growth rates (while essentially arbitrary) is broadly consistent<br />
– in terms <strong>of</strong> a range – with <strong>the</strong> growth rates experienced over recent years: taking <strong>the</strong> four<br />
countries examined in depth and <strong>the</strong> total <strong>of</strong> all Member States, <strong>the</strong> figures are as follows:<br />
Average annual employment growth<br />
over five years<br />
Percentage increase in <strong>the</strong> latest year for<br />
which <strong>the</strong>re is data<br />
Germany 9.5% 17.8%<br />
Ireland (unavailable) 11.2%<br />
Sweden 15.6% (over 3 years) 34.7%<br />
United Kingdom 12.9% 2.5%<br />
EU as a whole 11.6% 10.5%<br />
* The latest informed commentaries continue to confirm serious concern for <strong>the</strong> IT sector<br />
76<br />
| C E P I S I.T. PRACTITIONER SKILLS IN EUROPE | Section 5