the Labour Market Survey Report - Council of European ...
the Labour Market Survey Report - Council of European ...
the Labour Market Survey Report - Council of European ...

Create successful ePaper yourself
Turn your PDF publications into a flip-book with our unique Google optimized e-Paper software.
Q1<br />
Q2<br />
2000 Q3<br />
Q4<br />
Q1<br />
Q2<br />
2001 Q3<br />
Q4<br />
Q1<br />
Q2<br />
2002 Q3<br />
Q4<br />
Q1<br />
Q2<br />
2003 Q3<br />
Q4<br />
Q1<br />
Q2<br />
2004 Q3<br />
Q4<br />
Q1<br />
Q2<br />
2005 Q3<br />
Q4<br />
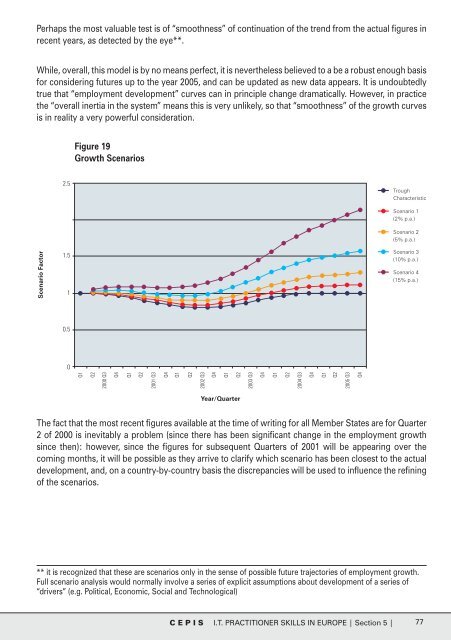
Perhaps <strong>the</strong> most valuable test is <strong>of</strong> “smoothness” <strong>of</strong> continuation <strong>of</strong> <strong>the</strong> trend from <strong>the</strong> actual figures in<br />
recent years, as detected by <strong>the</strong> eye**.<br />
While, overall, this model is by no means perfect, it is never<strong>the</strong>less believed to a be a robust enough basis<br />
for considering futures up to <strong>the</strong> year 2005, and can be updated as new data appears. It is undoubtedly<br />
true that “employment development” curves can in principle change dramatically. However, in practice<br />
<strong>the</strong> “overall inertia in <strong>the</strong> system” means this is very unlikely, so that “smoothness” <strong>of</strong> <strong>the</strong> growth curves<br />
is in reality a very powerful consideration.<br />
Figure 19<br />
Growth Scenarios<br />
(Source: Eurostat holdings <strong>of</strong> EU Member State <strong>Labour</strong> Force <strong>Survey</strong>s: data for ISCO 312)<br />
2.5<br />
Trough<br />
Characteristic<br />
Scenario 1<br />
(2% p.a.)<br />
Scenario 2<br />
(5% p.a.)<br />
Scenario Factor<br />
1.5<br />
1<br />
Scenario 3<br />
(10% p.a.)<br />
Scenario 4<br />
(15% p.a.)<br />
0.5<br />
0<br />
Year/Quarter<br />
The fact that <strong>the</strong> most recent figures available at <strong>the</strong> time <strong>of</strong> writing for all Member States are for Quarter<br />
2 <strong>of</strong> 2000 is inevitably a problem (since <strong>the</strong>re has been significant change in <strong>the</strong> employment growth<br />
since <strong>the</strong>n): however, since <strong>the</strong> figures for subsequent Quarters <strong>of</strong> 2001 will be appearing over <strong>the</strong><br />
coming months, it will be possible as <strong>the</strong>y arrive to clarify which scenario has been closest to <strong>the</strong> actual<br />
development, and, on a country-by-country basis <strong>the</strong> discrepancies will be used to influence <strong>the</strong> refining<br />
<strong>of</strong> <strong>the</strong> scenarios.<br />
** it is recognized that <strong>the</strong>se are scenarios only in <strong>the</strong> sense <strong>of</strong> possible future trajectories <strong>of</strong> employment growth.<br />
Full scenario analysis would normally involve a series <strong>of</strong> explicit assumptions about development <strong>of</strong> a series <strong>of</strong><br />
“drivers” (e.g. Political, Economic, Social and Technological)<br />
C E P I S I.T. PRACTITIONER SKILLS IN EUROPE | Section 5 | 77