
Create successful ePaper yourself
Turn your PDF publications into a flip-book with our unique Google optimized e-Paper software.
130 Y2 = PEEK(49319)/ 1.594<br />
140 HPLOT X,Yl TO X+l, Y2<br />
150 Y1 = Y2<br />
160 NEXT X<br />
170 END<br />
Try this program. Vary the potentiometer setting as the program is<br />
running. The plot should appear as the changes are made. A constant<br />
voltage will give you a horizontal line on the screen.<br />
Can you suggest a simple experiment that would demonstrate the<br />
use of the A/D converter and the graphics program<br />
There are several simple experiments that you might like to try.<br />
Each involves measuring a voltage that is proportional to the physical<br />
measurement that is being made. For example, you could measure<br />
the voltage across a photocell in changing light conditions, a<br />
voltage across a charging capacitor, or a voltage that is proportional<br />
to temperature.<br />
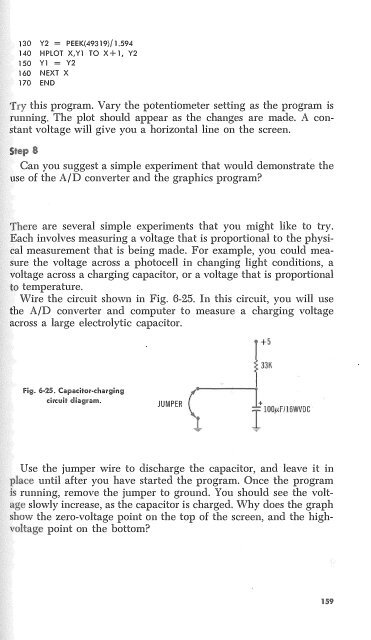
Wire the circuit shown in Fig. 6-25. In this circuit, you will use<br />
the A/D converter and computer to measure a charging voltage<br />
across a large electrolytic capacitor.<br />
Fig. 6-25. Capadi1>r·d1ar9ir19<br />
drcuili' diagram.<br />
c·""" ----._;; 1<br />
JUMPER l<br />
F<br />
i 100µF/16WVDC<br />
Use the jumper wire to discharge the capacitor, and leave it in<br />
until after you have started the program. Once the program<br />
running, remove the jumper to ground. You should see the voltslowly<br />
increase, as the capacitor is charged. Why does the graph<br />
the zero-voltage point on the top of the screen, and the high<br />
, ''""'<br />
point on the bottom