NATS-Annual-Report-2015
NATS-Annual-Report-2015
NATS-Annual-Report-2015

Create successful ePaper yourself
Turn your PDF publications into a flip-book with our unique Google optimized e-Paper software.
<strong>Annual</strong> <strong>Report</strong> and Accounts <strong>2015</strong> | <strong>NATS</strong> Holdings Limited<br />
Financial Statements 125<br />
Notes forming part of the<br />
consolidated accounts<br />
(continued)<br />
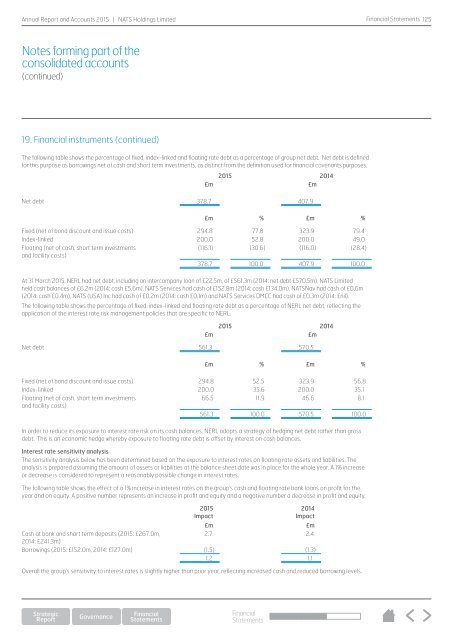
19. Financial instruments (continued)<br />
The following table shows the percentage of fixed, index-linked and floating rate debt as a percentage of group net debt. Net debt is defined<br />
for this purpose as borrowings net of cash and short term investments, as distinct from the definition used for financial covenants purposes.<br />
<strong>2015</strong> 2014<br />
£m £m<br />
Net debt 378.7 407.9<br />
£m % £m %<br />
Fixed (net of bond discount and issue costs) 294.8 77.8 323.9 79.4<br />
Index-linked 200.0 52.8 200.0 49.0<br />
Floating (net of cash, short term investments<br />
(116.1) (30.6) (116.0) (28.4)<br />
and facility costs)<br />
378.7 100.0 407.9 100.0<br />
At 31 March <strong>2015</strong>, NERL had net debt, including an intercompany loan of £22.5m, of £561.3m (2014: net debt £570.5m), <strong>NATS</strong> Limited<br />
held cash balances of £6.2m (2014: cash £5.6m), <strong>NATS</strong> Services had cash of £152.8m (2014: cash £134.0m), <strong>NATS</strong>Nav had cash of £0.6m<br />
(2014: cash £0.4m), <strong>NATS</strong> (USA) Inc had cash of £0.2m (2014: cash £0.1m) and <strong>NATS</strong> Services DMCC had cash of £0.3m (2014: £nil).<br />
The following table shows the percentage of fixed, index-linked and floating rate debt as a percentage of NERL net debt, reflecting the<br />
application of the interest rate risk management policies that are specific to NERL.<br />
<strong>2015</strong> 2014<br />
£m £m<br />
Net debt 561.3 570.5<br />
£m % £m %<br />
Fixed (net of bond discount and issue costs) 294.8 52.5 323.9 56.8<br />
Index-linked 200.0 35.6 200.0 35.1<br />
Floating (net of cash, short term investments<br />
66.5 11.9 46.6 8.1<br />
and facility costs)<br />
561.3 100.0 570.5 100.0<br />
In order to reduce its exposure to interest rate risk on its cash balances, NERL adopts a strategy of hedging net debt rather than gross<br />
debt. This is an economic hedge whereby exposure to floating rate debt is offset by interest on cash balances.<br />
Interest rate sensitivity analysis<br />
The sensitivity analysis below has been determined based on the exposure to interest rates on floating rate assets and liabilities. The<br />
analysis is prepared assuming the amount of assets or liabilities at the balance sheet date was in place for the whole year. A 1% increase<br />
or decrease is considered to represent a reasonably possible change in interest rates.<br />
The following table shows the effect of a 1% increase in interest rates on the group’s cash and floating rate bank loans on profit for the<br />
year and on equity. A positive number represents an increase in profit and equity and a negative number a decrease in profit and equity.<br />
<strong>2015</strong><br />
Impact<br />
2014<br />
Impact<br />
£m £m<br />
Cash at bank and short term deposits (<strong>2015</strong>: £267.0m,<br />
2.7 2.4<br />
2014: £241.3m)<br />
Borrowings (<strong>2015</strong>: £152.0m, 2014: £127.0m) (1.5) (1.3)<br />
1.2 1.1<br />
Overall the group’s sensitivity to interest rates is slightly higher than prior year, reflecting increased cash and reduced borrowing levels.<br />
Financial<br />
Statements