NATS-Annual-Report-2015
NATS-Annual-Report-2015
NATS-Annual-Report-2015

You also want an ePaper? Increase the reach of your titles
YUMPU automatically turns print PDFs into web optimized ePapers that Google loves.
<strong>Annual</strong> <strong>Report</strong> and Accounts <strong>2015</strong> | <strong>NATS</strong> Holdings Limited<br />
Strategic <strong>Report</strong><br />
41<br />
People and corporate responsibility<br />
(continued)<br />
Minimising the environmental impact of Air<br />
Traffic Management (ATM)<br />
The environmental impact of ATM is a key issue for our<br />
customers, regulators and communities. We have a number<br />
of targets that reflect our customers’ high priority for<br />
reduced CO 2<br />
emissions and fuel burn. These include:<br />
> A strategic target to reduce ATM related CO 2<br />
emissions<br />
by an average 10% per flight by 2020, from a 2006<br />
baseline. This applies to UK and North Atlantic airspace<br />
and airport tower services;<br />
> <strong>Annual</strong> flight efficiency target (3Di), which financially<br />
incentivises our performance in line with our strategic<br />
target. 3Di measures the efficiency of flight profiles in UK<br />
airspace;<br />
> Specific short term fuel savings targets agreed annually<br />
with customers via the OPA and the Fuel Efficiency<br />
Partnership (FEP). These target UK and North Atlantic<br />
airspace and airport tower services.<br />
Our strategic target is challenging but is achievable and<br />
supported by the investments assumed in RP2 and other<br />
short term procedural and tactical changes we have<br />
planned. Each of our operational units has embedded<br />
business plan targets to deliver this outcome. We are<br />
targeting a reduction of 32,000 tonnes in CO 2<br />
emissions<br />
in calendar year <strong>2015</strong>.<br />
Following an external review of our methodology for<br />
calculating the enabled savings in fuel and CO 2<br />
emissions<br />
from airspace changes and day to day improvements, we<br />
have restated our baseline and values reported since 2008<br />
to enhance the precision of our reporting.<br />
a. Progress in <strong>2015</strong><br />
To monitor progress against our strategic target, we<br />
set ourselves an interim target to reduce ATM related<br />
CO 2<br />
emissions by an average 4% per flight (from a<br />
2006 baseline) by the end of calendar year 2014. We<br />
actually achieved 4.3%, which equates to a reduction in<br />
CO 2<br />
emissions of over 1 million tonnes, or around £117m<br />
per annum in enabled fuel savings per annum to airline<br />
customers. This had improved to 4.55% at 31 March <strong>2015</strong>.<br />
The improvements are the result of changes to UK airspace<br />
that allow for more direct routes and improved vertical<br />
profiles; the use of more efficient procedures, such as<br />
continuous instead of stepped climbs and descents; and<br />
the introduction of new air traffic control technologies.<br />
Many changes to UK airspace and procedures have been<br />
made over the past six years to provide more efficient<br />
routes to airlines. This includes more flexible use of military<br />
airspace when not in use, which has reduced CO 2<br />
emissions<br />
by 30,000 tonnes alone, and the use of controller tools<br />
that provide the most efficient altitudes across the North<br />
Atlantic which has enabled a reduction of 110,000 tonnes of<br />
CO 2<br />
emissions.<br />
In 2014 <strong>NATS</strong> developed a tool which combines radar<br />
data with <strong>NATS</strong>’ 3Di airspace efficiency metric to produce<br />
a graphical representation of every flight in UK airspace.<br />
This enables controllers to review the 3Di score for every<br />
flight handled on their shift and to identify operational<br />
improvements by analysing the efficiency of flight profiles.<br />
Since April 2014, <strong>NATS</strong> has reduced airborne holding times<br />
through better arrivals management, saving airlines over £1<br />
million in fuel and reducing CO 2<br />
emissions by 7,000 tonnes.<br />
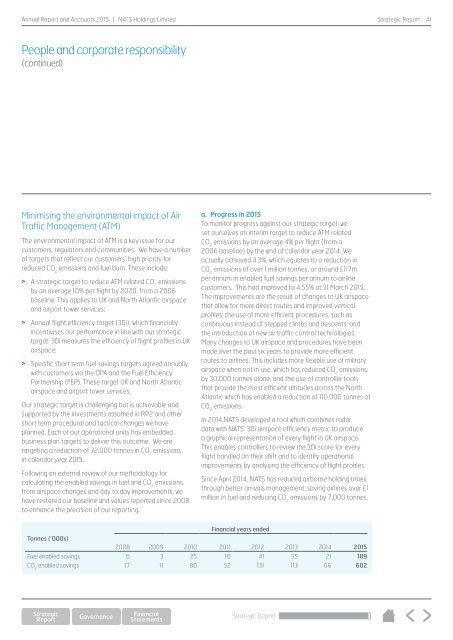
Financial years ended<br />
Tonnes (‘000s)<br />
2008 2009 2010 2011 2012 2013 2014 <strong>2015</strong><br />
Fuel enabled savings 6 3 25 16 41 35 21 189<br />
CO 2<br />
enabled savings 17 11 80 52 131 113 66 602<br />
Strategic <strong>Report</strong>