NATS-Annual-Report-2015
NATS-Annual-Report-2015
NATS-Annual-Report-2015

Create successful ePaper yourself
Turn your PDF publications into a flip-book with our unique Google optimized e-Paper software.
<strong>Annual</strong> <strong>Report</strong> and Accounts <strong>2015</strong> | <strong>NATS</strong> Holdings Limited<br />
Financial Statements 86<br />
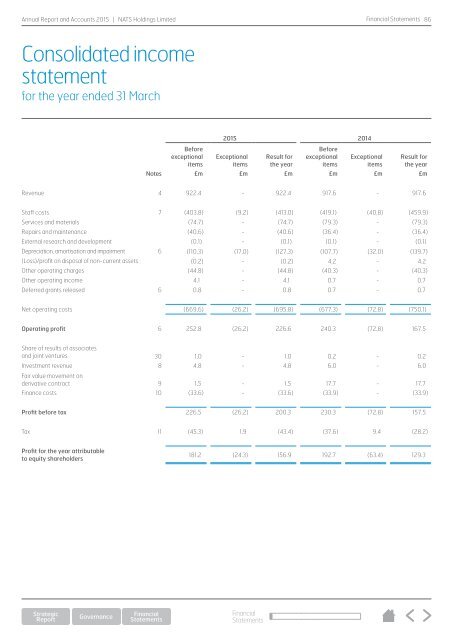
Consolidated income<br />
statement<br />
for the year ended 31 March<br />
Before<br />
exceptional<br />
items<br />
<strong>2015</strong> 2014<br />
Exceptional<br />
items<br />
Result for<br />
the year<br />
Before<br />
exceptional<br />
items<br />
Exceptional<br />
items<br />
Result for<br />
the year<br />
Notes £m £m £m £m £m £m<br />
Revenue 4 922.4 - 922.4 917.6 - 917.6<br />
Staff costs 7 (403.8) (9.2) (413.0) (419.1) (40.8) (459.9)<br />
Services and materials (74.7) - (74.7) (79.3) - (79.3)<br />
Repairs and maintenance (40.6) - (40.6) (36.4) - (36.4)<br />
External research and development (0.1) - (0.1) (0.1) - (0.1)<br />
Depreciation, amortisation and impairment 6 (110.3) (17.0) (127.3) (107.7) (32.0) (139.7)<br />
(Loss)/profit on disposal of non-current assets (0.2) - (0.2) 4.2 - 4.2<br />
Other operating charges (44.8) - (44.8) (40.3) - (40.3)<br />
Other operating income 4.1 - 4.1 0.7 - 0.7<br />
Deferred grants released 6 0.8 - 0.8 0.7 - 0.7<br />
Net operating costs (669.6) (26.2) (695.8) (677.3) (72.8) (750.1)<br />
Operating profit 6 252.8 (26.2) 226.6 240.3 (72.8) 167.5<br />
Share of results of associates<br />
and joint ventures 30 1.0 - 1.0 0.2 - 0.2<br />
Investment revenue 8 4.8 - 4.8 6.0 - 6.0<br />
Fair value movement on<br />
derivative contract 9 1.5 - 1.5 17.7 - 17.7<br />
Finance costs 10 (33.6) - (33.6) (33.9) - (33.9)<br />
Profit before tax 226.5 (26.2) 200.3 230.3 (72.8) 157.5<br />
Tax 11 (45.3) 1.9 (43.4) (37.6) 9.4 (28.2)<br />
Profit for the year attributable<br />
to equity shareholders<br />
181.2 (24.3) 156.9 192.7 (63.4) 129.3<br />
Financial<br />
Statements