NATS-Annual-Report-2015
NATS-Annual-Report-2015
NATS-Annual-Report-2015

You also want an ePaper? Increase the reach of your titles
YUMPU automatically turns print PDFs into web optimized ePapers that Google loves.
<strong>Annual</strong> <strong>Report</strong> and Accounts <strong>2015</strong> | <strong>NATS</strong> Holdings Limited<br />
Financial Statements 130<br />
Notes forming part of the<br />
consolidated accounts<br />
(continued)<br />
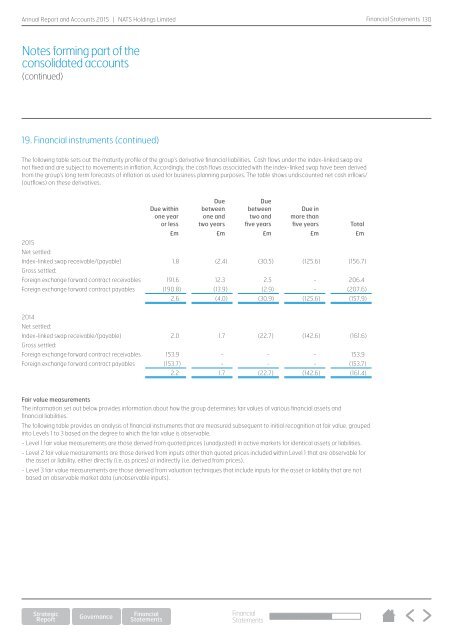
19. Financial instruments (continued)<br />
The following table sets out the maturity profile of the group’s derivative financial liabilities. Cash flows under the index-linked swap are<br />
not fixed and are subject to movements in inflation. Accordingly, the cash flows associated with the index-linked swap have been derived<br />
from the group’s long term forecasts of inflation as used for business planning purposes. The table shows undiscounted net cash inflows/<br />
(outflows) on these derivatives.<br />
Due within<br />
one year<br />
or less<br />
Due<br />
between<br />
one and<br />
two years<br />
Due<br />
between<br />
two and<br />
five years<br />
Due in<br />
more than<br />
five years<br />
Total<br />
£m £m £m £m £m<br />
<strong>2015</strong><br />
Net settled:<br />
Index-linked swap receivable/(payable) 1.8 (2.4) (30.5) (125.6) (156.7)<br />
Gross settled:<br />
Foreign exchange forward contract receivables 191.6 12.3 2.5 - 206.4<br />
Foreign exchange forward contract payables (190.8) (13.9) (2.9) - (207.6)<br />
2.6 (4.0) (30.9) (125.6) (157.9)<br />
2014<br />
Net settled:<br />
Index-linked swap receivable/(payable) 2.0 1.7 (22.7) (142.6) (161.6)<br />
Gross settled:<br />
Foreign exchange forward contract receivables 153.9 - - - 153.9<br />
Foreign exchange forward contract payables (153.7) - - - (153.7)<br />
2.2 1.7 (22.7) (142.6) (161.4)<br />
Fair value measurements<br />
The information set out below provides information about how the group determines fair values of various financial assets and<br />
financial liabilities.<br />
The following table provides an analysis of financial instruments that are measured subsequent to initial recognition at fair value, grouped<br />
into Levels 1 to 3 based on the degree to which the fair value is observable.<br />
- Level 1 fair value measurements are those derived from quoted prices (unadjusted) in active markets for identical assets or liabilities.<br />
- Level 2 fair value measurements are those derived from inputs other than quoted prices included within Level 1 that are observable for<br />
the asset or liability, either directly (i.e. as prices) or indirectly (i.e. derived from prices).<br />
- Level 3 fair value measurements are those derived from valuation techniques that include inputs for the asset or liability that are not<br />
based on observable market data (unobservable inputs).<br />
Financial<br />
Statements