NATS-Annual-Report-2015
NATS-Annual-Report-2015
NATS-Annual-Report-2015

Create successful ePaper yourself
Turn your PDF publications into a flip-book with our unique Google optimized e-Paper software.
<strong>Annual</strong> <strong>Report</strong> and Accounts <strong>2015</strong> | <strong>NATS</strong> Holdings Limited<br />
Strategic <strong>Report</strong> 23<br />
Key performance<br />
indicators<br />
We adopt a number of financial and non-financial Key<br />
Performance Indicators (KPIs) that enable us to track<br />
progress against our business plan objectives and which are<br />
relevant to the different activities of our principal operating<br />
subsidiaries: NERL and <strong>NATS</strong> Services. For NERL, KPIs<br />
are largely aligned with the SES key performance areas<br />
ensuring management focus on meeting safety, service<br />
quality, environmental and cost efficiency targets. For <strong>NATS</strong><br />
Services, the focus of management is on safety, customer<br />
service and on growing the business profitably. A number<br />
of the metrics are also used to set targets for remuneration<br />
purposes and so align incentives with business objectives<br />
and strategy.<br />
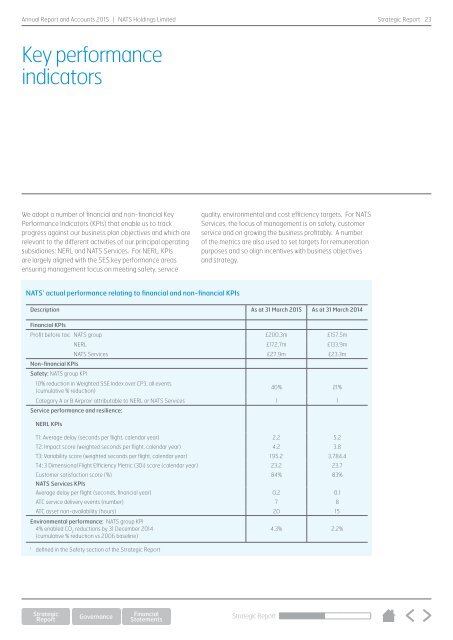
<strong>NATS</strong>’ actual performance relating to financial and non-financial KPIs<br />
Description As at 31 March <strong>2015</strong> As at 31 March 2014<br />
Financial KPIs<br />
Profit before tax: <strong>NATS</strong> group £200.3m £157.5m<br />
NERL £172.7m £133.9m<br />
<strong>NATS</strong> Services £27.9m £23.3m<br />
Non-financial KPIs<br />
Safety: <strong>NATS</strong> group KPI<br />
10% reduction in Weighted SSE Index over CP3, all events<br />
(cumulative % reduction)<br />
40% 21%<br />
Category A or B Airprox 1 attributable to NERL or <strong>NATS</strong> Services 1 1<br />
Service performance and resilience:<br />
NERL KPIs<br />
T1: Average delay (seconds per flight, calendar year) 2.2 5.2<br />
T2: Impact score (weighted seconds per flight, calendar year) 4.2 3.8<br />
T3: Variability score (weighted seconds per flight, calendar year) 195.2 3,784.4<br />
T4: 3 Dimensional Flight Efficiency Metric (3Di) score (calendar year) 23.2 23.7<br />
Customer satisfaction score (%) 84% 83%<br />
<strong>NATS</strong> Services KPIs<br />
Average delay per flight (seconds, financial year) 0.2 0.1<br />
ATC service delivery events (number) 7 8<br />
ATC asset non-availability (hours) 20 15<br />
Environmental performance: <strong>NATS</strong> group KPI<br />
4% enabled CO 2<br />
reductions by 31 December 2014<br />
(cumulative % reduction vs 2006 baseline)<br />
4.3% 2.2%<br />
1<br />
defined in the Safety section of the Strategic <strong>Report</strong><br />
Strategic <strong>Report</strong>