NATS-Annual-Report-2015
NATS-Annual-Report-2015
NATS-Annual-Report-2015

You also want an ePaper? Increase the reach of your titles
YUMPU automatically turns print PDFs into web optimized ePapers that Google loves.
<strong>Annual</strong> <strong>Report</strong> and Accounts <strong>2015</strong> | <strong>NATS</strong> Holdings Limited<br />
Strategic <strong>Report</strong><br />
37<br />
Review of service<br />
line performance<br />
Service line performance<br />
We organise our activities according to service lines, which<br />
reflect the products and services that we offer. A brief<br />
description is provided under the section entitled ‘Our<br />
business model’. This section explains the financial and<br />
operational performance of each service. The principal<br />
financial measures are revenue and contribution. The<br />
former includes intra-group revenue, while the latter reflects<br />
the operating costs which managers are able to influence<br />
directly. A reconciliation of service line contribution to the<br />
group’s operating profit is provided in the notes to the<br />
financial statements.<br />
<strong>NATS</strong> Airspace<br />
<strong>2015</strong> 2014<br />
Financial performance:<br />
Revenue (£m) 738.5 740.7<br />
Service line contribution (£m) 380.2 391.6<br />
Capital expenditure (£m) 152.3 125.5<br />
Operational performance:<br />
Flights handled (‘000s) 2,216 2,162<br />
Risk-bearing airprox (no.) 1 1<br />
Average delay per flight (seconds) 2.2 5.4<br />
Enabled fuel savings (tonnes) 189,000 21,000*<br />
* restated<br />
<strong>NATS</strong> Airspace includes all of NERL’s economically<br />
regulated activities. It generated revenue of £738.5m, a<br />
0.3% reduction on the previous year. This included the<br />
impact of RP2 price reductions from January <strong>2015</strong> which<br />
offset an improved service incentive and the impact of<br />
pricing below the level of permitted revenue allowances in<br />
2014. Last year’s income also included a one-off benefit for<br />
the back-up Galileo satellite monitoring facility at Swanwick.<br />
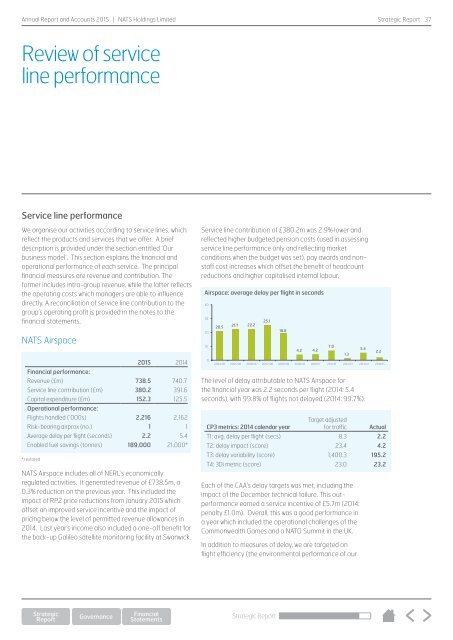
Service line contribution of £380.2m was 2.9% lower and<br />
reflected higher budgeted pension costs (used in assessing<br />
service line performance only and reflecting market<br />
conditions when the budget was set), pay awards and nonstaff<br />
cost increases which offset the benefit of headcount<br />
reductions and higher capitalised internal labour.<br />
Airspace: average Airspace: delay average per flight delay per in seconds flight in seconds<br />
40<br />
30<br />
20<br />
10<br />
0<br />
20.5<br />
21.7 22.2<br />
25.1<br />
The level of delay attributable to <strong>NATS</strong> Airspace for<br />
the financial year was 2.2 seconds per flight (2014: 5.4<br />
seconds), with 99.8% of flights not delayed (2014: 99.7%).<br />
Each of the CAA’s delay targets was met, including the<br />
impact of the December technical failure. This outperformance<br />
earned a service incentive of £5.7m (2014:<br />
penalty £1.0m). Overall, this was a good performance in<br />
a year which included the operational challenges of the<br />
Commonwealth Games and a NATO Summit in the UK.<br />
In addition to measures of delay, we are targeted on<br />
flight efficiency (the environmental performance of our<br />
18.8<br />
4.2 4.2<br />
2004/05 2005/06 2006/07 2007/08 2008/09 2009/10 2010/11 2011/12 2012/13 2013/14 2014/15<br />
CP3 metrics: 2014 calendar year<br />
Target adjusted<br />
for traffic Actual<br />
T1: avg. delay per flight (secs) 8.3 2.2<br />
T2: delay impact (score) 23.4 4.2<br />
T3: delay variability (score) 1,400.3 195.2<br />
T4: 3Di metric (score) 23.0 23.2<br />
7.0<br />
1.3<br />
5.4<br />
2.2<br />
Strategic <strong>Report</strong>