NATS-Annual-Report-2015
NATS-Annual-Report-2015
NATS-Annual-Report-2015

Create successful ePaper yourself
Turn your PDF publications into a flip-book with our unique Google optimized e-Paper software.
<strong>Annual</strong> <strong>Report</strong> and Accounts <strong>2015</strong> | <strong>NATS</strong> Holdings Limited<br />
Strategic <strong>Report</strong><br />
19<br />
Financial review<br />
(continued)<br />
Taxation<br />
The tax charge of £43.4m (2014: £28.2m) was at an<br />
effective rate of 21.7% (2014: 17.9%). This is higher than<br />
the headline rate of 21%, mainly reflecting the goodwill<br />
impairment charge, which is not tax deductible, partly offset<br />
by a patent box claim relating to air traffic control software.<br />
The prior year also included the deferred tax impact of the<br />
reduction in the corporation tax rate to 20% from April<br />
<strong>2015</strong>.<br />
<strong>NATS</strong> taxes generally arise in the UK, though it undertakes<br />
business in other countries. Wherever we operate we<br />
organise our operations to pay the correct and appropriate<br />
amount of tax at the right time, according to relevant<br />
national laws, and ensure compliance with the group’s tax<br />
policies and guidelines. The group’s tax strategy is reviewed<br />
annually by a Tax Committee and covers the application<br />
of all direct and indirect taxes to our business including<br />
corporation tax, payroll taxes and value added tax.<br />
The Tax Committee comprises the Finance Director, the<br />
Head of Tax and other senior finance professionals and<br />
takes advice from a professional firm.<br />
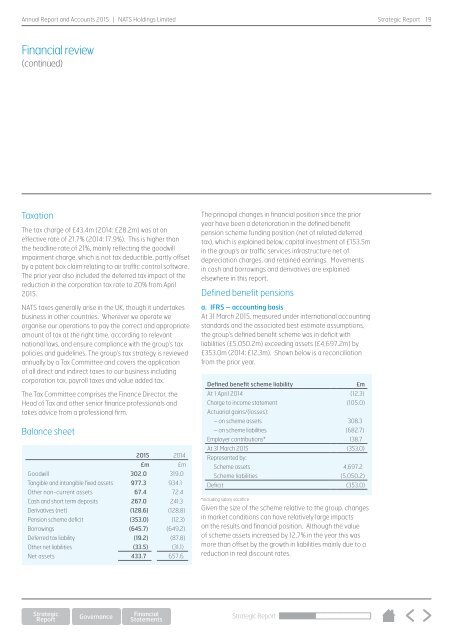
Balance sheet<br />
<strong>2015</strong> 2014<br />
£m £m<br />
Goodwill 302.0 319.0<br />
Tangible and intangible fixed assets 977.3 934.1<br />
Other non-current assets 67.4 72.4<br />
Cash and short term deposits 267.0 241.3<br />
Derivatives (net) (128.6) (128.8)<br />
Pension scheme deficit (353.0) (12.3)<br />
Borrowings (645.7) (649.2)<br />
Deferred tax liability (19.2) (87.8)<br />
Other net liabilities (33.5) (31.1)<br />
Net assets 433.7 657.6<br />
The principal changes in financial position since the prior<br />
year have been a deterioration in the defined benefit<br />
pension scheme funding position (net of related deferred<br />
tax), which is explained below, capital investment of £153.5m<br />
in the group’s air traffic services infrastructure net of<br />
depreciation charges, and retained earnings. Movements<br />
in cash and borrowings and derivatives are explained<br />
elsewhere in this report.<br />
Defined benefit pensions<br />
a. IFRS – accounting basis<br />
At 31 March <strong>2015</strong>, measured under international accounting<br />
standards and the associated best estimate assumptions,<br />
the group’s defined benefit scheme was in deficit with<br />
liabilities (£5,050.2m) exceeding assets (£4,697.2m) by<br />
£353.0m (2014: £12.3m). Shown below is a reconciliation<br />
from the prior year.<br />
Defined benefit scheme liability £m<br />
At 1 April 2014 (12.3)<br />
Charge to income statement (105.0)<br />
Actuarial gains/(losses):<br />
– on scheme assets 308.3<br />
– on scheme liabilities (682.7)<br />
Employer contributions* 138.7<br />
At 31 March <strong>2015</strong> (353.0)<br />
Represented by:<br />
Scheme assets 4,697.2<br />
Scheme liabilities (5,050.2)<br />
Deficit (353.0)<br />
*including salary sacrifice<br />
Given the size of the scheme relative to the group, changes<br />
in market conditions can have relatively large impacts<br />
on the results and financial position. Although the value<br />
of scheme assets increased by 12.7% in the year this was<br />
more than offset by the growth in liabilities mainly due to a<br />
reduction in real discount rates.<br />
Strategic <strong>Report</strong>