NATS-Annual-Report-2015
NATS-Annual-Report-2015
NATS-Annual-Report-2015

Create successful ePaper yourself
Turn your PDF publications into a flip-book with our unique Google optimized e-Paper software.
<strong>Annual</strong> <strong>Report</strong> and Accounts <strong>2015</strong> | <strong>NATS</strong> Holdings Limited<br />
Strategic <strong>Report</strong><br />
15<br />
Financial review<br />
(continued)<br />
Regulatory return<br />
We assess the performance of NERL’s regulated activities<br />
by reference to the regulatory settlement. For the four<br />
years of CP3, NERL achieved a pre-tax real return of just<br />
over 8% compared with the regulatory return of 6.76%<br />
assumed in the regulatory settlement. This was mainly<br />
achieved through service performance incentives and<br />
operating cost efficiencies which offset the impact of lower<br />
traffic volumes.<br />
The cost of capital for RP2 has been set at 5.86% (pretax<br />
real) which, together with challenging cost efficiency<br />
targets, will result in a reduction in NERL’s revenue and is<br />
also very likely to result in lower regulatory profit in RP2.<br />
Comparison between reported profit<br />
and regulatory return<br />
The profits reported in these financial statements are<br />
prepared in accordance with International Financial<br />
<strong>Report</strong>ing Standard (IFRS) and policies described in note 2<br />
to these accounts. As described above, the CAA applies an<br />
economic regulatory building block model which is mainly<br />
cash-based. It can give rise to some significant differences<br />
between reported operating profit and regulatory return,<br />
mainly due to:<br />
> lower historical cost depreciation compared with<br />
regulatory depreciation which is indexed to inflation; and<br />
> lower accounting pension costs using best estimate<br />
assumptions prescribed by accounting standards<br />
compared with the cash contributions agreed with<br />
Trustees, which include a margin for prudence.<br />
This difference in basis explains why NERL’s reported<br />
operating profit is some £78m higher than its regulatory<br />
profit. This regulatory view is set out in NERL’s audited<br />
published regulatory accounts.<br />
Revenue<br />
Revenue increased by £4.8m to £922.4m (2014: £917.6m).<br />
The RP2 settlement, which applied from January <strong>2015</strong>, is<br />
reducing UK en route revenue allowances but during the<br />
year this was offset by the combined effects of air traffic<br />
volume growth, service quality incentives, airport contract<br />
indexation and the benefit of Project Marshall.<br />
These and other factors are described in the Review<br />
of service line performance.<br />
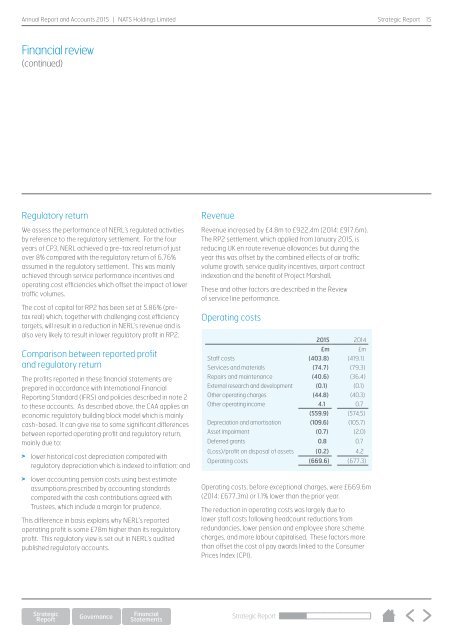
Operating costs<br />
<strong>2015</strong> 2014<br />
£m £m<br />
Staff costs (403.8) (419.1)<br />
Services and materials (74.7) (79.3)<br />
Repairs and maintenance (40.6) (36.4)<br />
External research and development (0.1) (0.1)<br />
Other operating charges (44.8) (40.3)<br />
Other operating income 4.1 0.7<br />
(559.9) (574.5)<br />
Depreciation and amortisation (109.6) (105.7)<br />
Asset impairment (0.7) (2.0)<br />
Deferred grants 0.8 0.7<br />
(Loss)/profit on disposal of assets (0.2) 4.2<br />
Operating costs (669.6) (677.3)<br />
Operating costs, before exceptional charges, were £669.6m<br />
(2014: £677.3m) or 1.1% lower than the prior year.<br />
The reduction in operating costs was largely due to<br />
lower staff costs following headcount reductions from<br />
redundancies, lower pension and employee share scheme<br />
charges, and more labour capitalised. These factors more<br />
than offset the cost of pay awards linked to the Consumer<br />
Prices Index (CPI).<br />
Strategic <strong>Report</strong>