

recent developments in high frequency financial ... - Index of
recent developments in high frequency financial ... - Index of
recent developments in high frequency financial ... - Index of

Create successful ePaper yourself
Turn your PDF publications into a flip-book with our unique Google optimized e-Paper software.
The performance analysis <strong>of</strong> chart patterns 211<br />
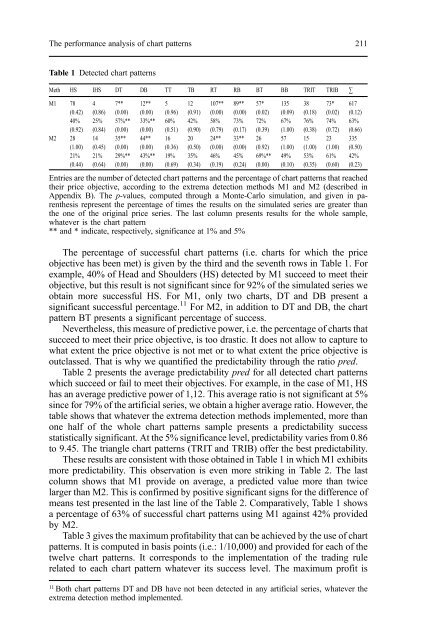
Table 1 Detected chart patterns<br />
Meth HS IHS DT DB TT TB RT RB BT BB TRIT TRIB ∑<br />
M1 78 4 7** 12** 5 12 107** 89** 57* 135 38 73* 617<br />
(0.42) (0.86) (0.00) (0.00) (0.96) (0.91) (0.00) (0.00) (0.02) (0.09) (0.18) (0.02) (0.12)<br />
40% 25% 57%** 33%** 60% 42% 58% 73% 72% 67% 76% 74% 63%<br />
(0.92) (0.84) (0.00) (0.00) (0.51) (0.90) (0.79) (0.17) (0.39) (1.00) (0.38) (0.72) (0.66)<br />
M2 28 14 35** 44** 16 20 24** 33** 26 57 15 23 335<br />
(1.00) (0.45) (0.00) (0.00) (0.36) (0.50) (0.00) (0.00) (0.92) (1.00) (1.00) (1.00) (0.50)<br />
21% 21% 29%** 43%** 19% 35% 46% 45% 69%** 49% 53% 61% 42%<br />
(0.44) (0.64) (0.00) (0.00) (0.69) (0.34) (0.19) (0.24) (0.00) (0.10) (0.35) (0.60) (0.23)<br />
Entries are the number <strong>of</strong> detected chart patterns and the percentage <strong>of</strong> chart patterns that reached<br />
their price objective, accord<strong>in</strong>g to the extrema detection methods M1 and M2 (described <strong>in</strong><br />
Appendix B). The p-values, computed through a Monte-Carlo simulation, and given <strong>in</strong> parenthesis<br />
represent the percentage <strong>of</strong> times the results on the simulated series are greater than<br />
the one <strong>of</strong> the orig<strong>in</strong>al price series. The last column presents results for the whole sample,<br />
whatever is the chart pattern<br />
** and * <strong>in</strong>dicate, respectively, significance at 1% and 5%<br />
The percentage <strong>of</strong> successful chart patterns (i.e. charts for which the price<br />
objective has been met) is given by the third and the seventh rows <strong>in</strong> Table 1. For<br />
example, 40% <strong>of</strong> Head and Shoulders (HS) detected by M1 succeed to meet their<br />
objective, but this result is not significant s<strong>in</strong>ce for 92% <strong>of</strong> the simulated series we<br />
obta<strong>in</strong> more successful HS. For M1, only two charts, DT and DB present a<br />
significant successful percentage. 11 For M2, <strong>in</strong> addition to DT and DB, the chart<br />
pattern BT presents a significant percentage <strong>of</strong> success.<br />
Nevertheless, this measure <strong>of</strong> predictive power, i.e. the percentage <strong>of</strong> charts that<br />
succeed to meet their price objective, is too drastic. It does not allow to capture to<br />
what extent the price objective is not met or to what extent the price objective is<br />
outclassed. That is why we quantified the predictability through the ratio pred.<br />
Table 2 presents the average predictability pred for all detected chart patterns<br />
which succeed or fail to meet their objectives. For example, <strong>in</strong> the case <strong>of</strong> M1, HS<br />
has an average predictive power <strong>of</strong> 1,12. This average ratio is not significant at 5%<br />
s<strong>in</strong>ce for 79% <strong>of</strong> the artificial series, we obta<strong>in</strong> a <strong>high</strong>er average ratio. However, the<br />
table shows that whatever the extrema detection methods implemented, more than<br />
one half <strong>of</strong> the whole chart patterns sample presents a predictability success<br />
statistically significant. At the 5% significance level, predictability varies from 0.86<br />
to 9.45. The triangle chart patterns (TRIT and TRIB) <strong>of</strong>fer the best predictability.<br />
These results are consistent with those obta<strong>in</strong>ed <strong>in</strong> Table 1 <strong>in</strong> which M1 exhibits<br />
more predictability. This observation is even more strik<strong>in</strong>g <strong>in</strong> Table 2. The last<br />
column shows that M1 provide on average, a predicted value more than twice<br />
larger than M2. This is confirmed by positive significant signs for the difference <strong>of</strong><br />
means test presented <strong>in</strong> the last l<strong>in</strong>e <strong>of</strong> the Table 2. Comparatively, Table 1 shows<br />
a percentage <strong>of</strong> 63% <strong>of</strong> successful chart patterns us<strong>in</strong>g M1 aga<strong>in</strong>st 42% provided<br />
by M2.<br />
Table 3 gives the maximum pr<strong>of</strong>itability that can be achieved by the use <strong>of</strong> chart<br />
patterns. It is computed <strong>in</strong> basis po<strong>in</strong>ts (i.e.: 1/10,000) and provided for each <strong>of</strong> the<br />
twelve chart patterns. It corresponds to the implementation <strong>of</strong> the trad<strong>in</strong>g rule<br />
related to each chart pattern whatever its success level. The maximum pr<strong>of</strong>it is<br />
11 Both chart patterns DT and DB have not been detected <strong>in</strong> any artificial series, whatever the<br />
extrema detection method implemented.


