

recent developments in high frequency financial ... - Index of
recent developments in high frequency financial ... - Index of
recent developments in high frequency financial ... - Index of

You also want an ePaper? Increase the reach of your titles
YUMPU automatically turns print PDFs into web optimized ePapers that Google loves.
A multivariate <strong>in</strong>teger count hurdle model 37<br />
3 Bivariate modell<strong>in</strong>g <strong>of</strong> exchange rate changes<br />
Data description<br />
We apply our model to 1 m<strong>in</strong> mid quote changes <strong>of</strong> the EUR/GBP and the<br />
EUR/USD exchange rates. The data has been provided by Olsen F<strong>in</strong>ancial Technologies<br />
and conta<strong>in</strong>s quotes from the electronic foreign exchange <strong>in</strong>terbank<br />
market. The period under study spreads between October 6 (Monday), 2003, 0:01<br />
EST, and October 10 (Friday), 2003, 17:00 EST, result<strong>in</strong>g <strong>in</strong> 6,780 observations for<br />
both time series. The sampl<strong>in</strong>g <strong>frequency</strong> <strong>of</strong> 1 m<strong>in</strong> is, on the one side, sufficiently<br />
<strong>high</strong> to ma<strong>in</strong>ta<strong>in</strong> the discrete nature <strong>of</strong> the data, whereas on the other side, it is low<br />
enough to preserve a significant correlation between the two marg<strong>in</strong>al processes.<br />
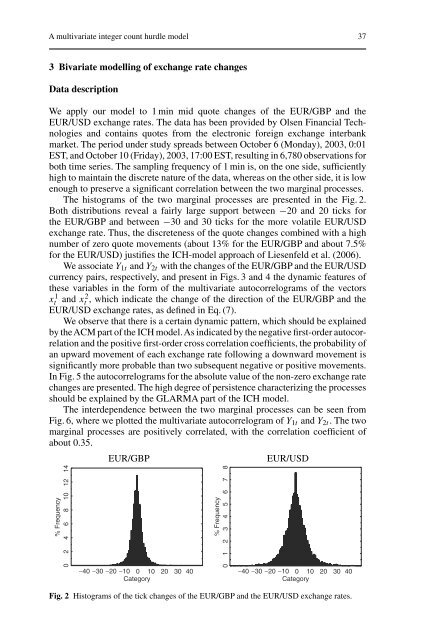
The histograms <strong>of</strong> the two marg<strong>in</strong>al processes are presented <strong>in</strong> the Fig. 2.<br />
Both distributions reveal a fairly large support between −20 and 20 ticks for<br />
the EUR/GBP and between −30 and 30 ticks for the more volatile EUR/USD<br />
exchange rate. Thus, the discreteness <strong>of</strong> the quote changes comb<strong>in</strong>ed with a <strong>high</strong><br />
number <strong>of</strong> zero quote movements (about 13% for the EUR/GBP and about 7.5%<br />
for the EUR/USD) justifies the ICH-model approach <strong>of</strong> Liesenfeld et al. (2006).<br />
We associate Y1t and Y2t with the changes <strong>of</strong> the EUR/GBP and the EUR/USD<br />
currency pairs, respectively, and present <strong>in</strong> Figs. 3 and 4 the dynamic features <strong>of</strong><br />
these variables <strong>in</strong> the form <strong>of</strong> the multivariate autocorrelograms <strong>of</strong> the vectors<br />
x 1 t and x2 t<br />
, which <strong>in</strong>dicate the change <strong>of</strong> the direction <strong>of</strong> the EUR/GBP and the<br />
EUR/USD exchange rates, as def<strong>in</strong>ed <strong>in</strong> Eq. (7).<br />
We observe that there is a certa<strong>in</strong> dynamic pattern, which should be expla<strong>in</strong>ed<br />
by theACM part <strong>of</strong> the ICH model.As <strong>in</strong>dicated by the negative first-order autocorrelation<br />
and the positive first-order cross correlation coefficients, the probability <strong>of</strong><br />
an upward movement <strong>of</strong> each exchange rate follow<strong>in</strong>g a downward movement is<br />
significantly more probable than two subsequent negative or positive movements.<br />
In Fig. 5 the autocorrelograms for the absolute value <strong>of</strong> the non-zero exchange rate<br />
changes are presented. The <strong>high</strong> degree <strong>of</strong> persistence characteriz<strong>in</strong>g the processes<br />
should be expla<strong>in</strong>ed by the GLARMA part <strong>of</strong> the ICH model.<br />
The <strong>in</strong>terdependence between the two marg<strong>in</strong>al processes can be seen from<br />
Fig. 6, where we plotted the multivariate autocorrelogram <strong>of</strong> Y1t and Y2t. The two<br />
marg<strong>in</strong>al processes are positively correlated, with the correlation coefficient <strong>of</strong><br />
about 0.35.<br />
% Frequency<br />
0 2 4 6 8 10 12 14<br />
EUR/GBP EUR/USD<br />
% Frequency<br />
0 1 2 3 4 5 6 7 8<br />
−40 −30 −20 −10 0 10 20 30 40 −40 −30 −20 −10 0 10 20 30 40<br />
Category<br />
Category<br />
Fig. 2 Histograms <strong>of</strong> the tick changes <strong>of</strong> the EUR/GBP and the EUR/USD exchange rates.


