ÐвигаÑели внÑÑÑеннего ÑгоÑаниÑ. 2010. â2 PDF (Size:7770 ÐÐ)
ÐвигаÑели внÑÑÑеннего ÑгоÑаниÑ. 2010. â2 PDF (Size:7770 ÐÐ)
ÐвигаÑели внÑÑÑеннего ÑгоÑаниÑ. 2010. â2 PDF (Size:7770 ÐÐ)

Create successful ePaper yourself
Turn your PDF publications into a flip-book with our unique Google optimized e-Paper software.
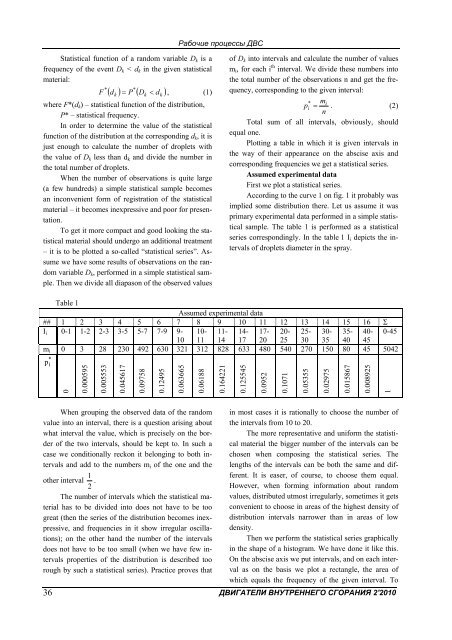
Рабочие процессы ДВСStatistical function of a random variable D k is afrequency of the event D k < d k in the given statisticalmaterial:( d ) = P* ( D d )F * < , (1)kwhere F*(d k ) – statistical function of the distribution,P* – statistical frequency.In order to determine the value of the statisticalfunction of the distribution at the corresponding d k , it isjust enough to calculate the number of droplets withthe value of D k less than d k and divide the number inthe total number of droplets.When the number of observations is quite large(a few hundreds) a simple statistical sample becomesan inconvenient form of registration of the statisticalmaterial – it becomes inexpressive and poor for presentation.To get it more compact and good looking the statisticalmaterial should undergo an additional treatment– it is to be plotted a so-called “statistical series”. Assumewe have some results of observations on the randomvariable D k , performed in a simple statistical sample.Then we divide all diapason of the observed valueskkof D k into intervals and calculate the number of valuesm i , for each i th interval. We divide these numbers intothe total number of the observations n and get the frequency,corresponding to the given interval:* mip i = . (2)nTotal sum of all intervals, obviously, shouldequal one.Plotting a table in which it is given intervals inthe way of their appearance on the abscise axis andcorresponding frequencies we get a statistical series.Assumed experimental dataFirst we plot a statistical series.According to the curve 1 on fig. 1 it probably wasimplied some distribution there. Let us assume it wasprimary experimental data performed in a simple statisticalsample. The table 1 is performed as a statisticalseries correspondingly. In the table 1 I i depicts the intervalsof droplets diameter in the spray.Table 1Assumed experimental data## 1 2 3 4 5 6 7 8 9 10 11 12 13 14 15 16 ΣI i 0-1 1-2 2-3 3-5 5-7 7-9 9- 10- 11- 14- 17- 20- 25- 30- 35- 40- 0-4510 11 14 17 20 25 30 35 40 45m i 0 3 28 230 492 630 321 312 828 633 480 540 270 150 80 45 5042*p i00.0005950.0055530.0456170.097580.124950.0636650.061880.1642210.1255450.09520.10710.053550.029750.0158670.0089251When grouping the observed data of the randomvalue into an interval, there is a question arising aboutwhat interval the value, which is precisely on the borderof the two intervals, should be kept to. In such acase we conditionally reckon it belonging to both intervalsand add to the numbers m i of the one and theother interval 21 .The number of intervals which the statistical materialhas to be divided into does not have to be toogreat (then the series of the distribution becomes inexpressive,and frequencies in it show irregular oscillations);on the other hand the number of the intervalsdoes not have to be too small (when we have few intervalsproperties of the distribution is described toorough by such a statistical series). Practice proves that36in most cases it is rationally to choose the number ofthe intervals from 10 to 20.The more representative and uniform the statisticalmaterial the bigger number of the intervals can bechosen when composing the statistical series. Thelengths of the intervals can be both the same and different.It is easer, of course, to choose them equal.However, when forming information about randomvalues, distributed utmost irregularly, sometimes it getsconvenient to choose in areas of the highest density ofdistribution intervals narrower than in areas of lowdensity.Then we perform the statistical series graphicallyin the shape of a histogram. We have done it like this.On the abscise axis we put intervals, and on each intervalas on the basis we plot a rectangle, the area ofwhich equals the frequency of the given interval. ToДВИГАТЕЛИ ВНУТРЕННЕГО СГОРАНИЯ 2'2010