

2011 The Palm Beach County Family Study (Full Report)
2011 The Palm Beach County Family Study (Full Report)
2011 The Palm Beach County Family Study (Full Report)
- No tags were found...

You also want an ePaper? Increase the reach of your titles
YUMPU automatically turns print PDFs into web optimized ePapers that Google loves.
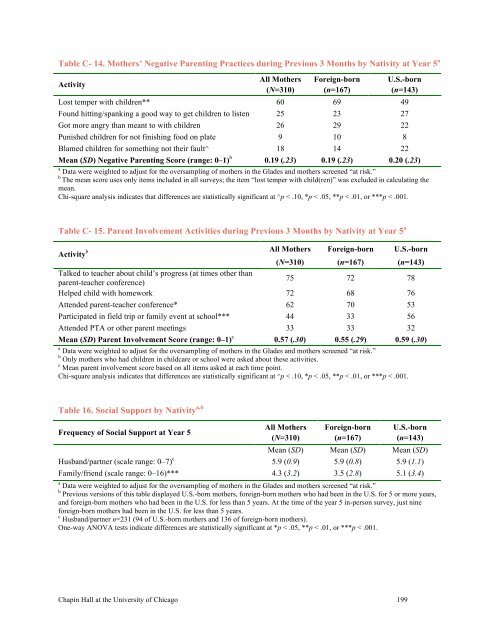
Table C- 14. Mothers’ Negative Parenting Practices during Previous 3 Months by Nativity at Year 5 aActivityAll Mothers Foreign-born U.S.-born(N=310) (n=167) (n=143)Lost temper with children** 60 69 49Found hitting/spanking a good way to get children to listen 25 23 27Got more angry than meant to with children 26 29 22Punished children for not finishing food on plate 9 10 8Blamed children for something not their fault^ 18 14 22Mean (SD) Negative Parenting Score (range: 0–1) b 0.19 (.23) 0.19 (.23) 0.20 (.23)a Data were weighted to adjust for the oversampling of mothers in the Glades and mothers screened “at risk.”b<strong>The</strong> mean score uses only items included in all surveys; the item “lost temper with child(ren)” was excluded in calculating themean.Chi-square analysis indicates that differences are statistically significant at ^p < .10, *p < .05, **p < .01, or ***p < .001.Table C- 15. Parent Involvement Activities during Previous 3 Months by Nativity at Year 5 aActivity b All Mothers Foreign-born U.S.-born(N=310) (n=167) (n=143)Talked to teacher about child’s progress (at times other thanparent-teacher conference)75 72 78Helped child with homework 72 68 76Attended parent-teacher conference* 62 70 53Participated in field trip or family event at school*** 44 33 56Attended PTA or other parent meetings 33 33 32Mean (SD) Parent Involvement Score (range: 0–1) c 0.57 (.30) 0.55 (.29) 0.59 (.30)a Data were weighted to adjust for the oversampling of mothers in the Glades and mothers screened “at risk.”b Only mothers who had children in childcare or school were asked about these activities.c Mean parent involvement score based on all items asked at each time point.Chi-square analysis indicates that differences are statistically significant at ^p < .10, *p < .05, **p < .01, or ***p < .001.Table 16. Social Support by Nativity a,b All Mothers Foreign-born U.S.-bornFrequency of Social Support at Year 5(N=310) (n=167) (n=143)Mean (SD) Mean (SD) Mean (SD)Husband/partner (scale range: 0–7) c 5.9 (0.9) 5.9 (0.8) 5.9 (1.1)<strong>Family</strong>/friend (scale range: 0–16)*** 4.3 (3.2) 3.5 (2.8) 5.1 (3.4)a Data were weighted to adjust for the oversampling of mothers in the Glades and mothers screened “at risk.”b Previous versions of this table displayed U.S.-born mothers, foreign-born mothers who had been in the U.S. for 5 or more years,and foreign-born mothers who had been in the U.S. for less than 5 years. At the time of the year 5 in-person survey, just nineforeign-born mothers had been in the U.S. for less than 5 years.c Husband/partner n=231 (94 of U.S.-born mothers and 136 of foreign-born mothers).One-way ANOVA tests indicate differences are statistically significant at *p < .05, **p < .01, or ***p < .001.Chapin Hall at the University of Chicago 199


