- Page 1 and 2:
FifthMarciaGouvêa2011
- Page 3:
AcknowledgmentsThis fifth report of
- Page 6 and 7:
Chapin Hall at the University of Ch
- Page 8 and 9:
List of TablesTable 1. Components o
- Page 10 and 11:
Table 58. Logistic Regression of Mo
- Page 12 and 13:
Table C- 24. Mothers’ Baseline an
- Page 16 and 17:
• In addition, we observed a pote
- Page 18 and 19:
kind of out-of-home educational exp
- Page 20 and 21:
IntroductionOver the last three dec
- Page 22 and 23:
eadiness and school success and in
- Page 24 and 25:
The study’s comprehensive, longit
- Page 26 and 27:
Table 2. Characteristics of Mothers
- Page 28 and 29:
The Year 5 Study SampleTable 4 show
- Page 30 and 31:
Household Structure, Employment, an
- Page 32 and 33:
Although mothers continued to repor
- Page 34 and 35:
Table 6. Family Income and Economic
- Page 36 and 37:
Specifically, mothers living outsid
- Page 38 and 39:
at the birth of the focal child tha
- Page 40 and 41:
Table 10. Reasons for Transportatio
- Page 42 and 43:
Health, Healthcare, and ChildDevelo
- Page 44 and 45:
two years of the study. In year 1 1
- Page 46 and 47:
Subsequent Pregnancies and Prenatal
- Page 48 and 49:
Children’s HealthcareMost (80%) o
- Page 50 and 51:
private plans or HMOs increased sig
- Page 52 and 53:
outside the TGAs to report that all
- Page 54 and 55:
Children’s Behavior and Developme
- Page 56 and 57:
cultural norms regarding what sorts
- Page 58 and 59:
Table 21. Emerging Pre-academic Ski
- Page 60 and 61:
the year 5 interview, over three-qu
- Page 62:
various activities, mothers reporte
- Page 66 and 67:
Negative Parenting PracticesThere i
- Page 68 and 69:
Table 28. Fathers’ Negative Paren
- Page 70 and 71:
Table 30. Parent Involvement Activi
- Page 72 and 73:
Table 32. Mothers’ Positive Paren
- Page 74 and 75:
Table 34. Mothers’ Parent Involve
- Page 76 and 77:
The most frequent parent involvemen
- Page 78 and 79:
Figure 3. Primary Childcare Arrange
- Page 80 and 81:
for 6 months, but when the subsidy
- Page 82 and 83:
ecause it is of particular interest
- Page 84 and 85:
types of care between mothers whose
- Page 86 and 87:
Table 40. Characteristics of Mother
- Page 88 and 89:
Table 41). Of the 204 children, 91
- Page 90 and 91:
commented on their children’s nee
- Page 92 and 93:
nonparental childcare arrangement f
- Page 94 and 95:
Informal and Community SupportAn un
- Page 96 and 97:
Table 46. Frequency of Husband/Part
- Page 98 and 99:
We also asked the mothers about the
- Page 100 and 101:
Table 49. Type of Family/Friends Su
- Page 102 and 103:
Access to Support by TGAFigure 5 sh
- Page 104 and 105:
Use of Formal ServicesA central que
- Page 106 and 107:
Correlates of At-Risk StatusA large
- Page 108 and 109:
services after 6 months. Among the
- Page 110 and 111:
Enhanced ServicesEnhanced services
- Page 112 and 113:
Termination of MCHP ServicesAs prev
- Page 114 and 115:
services were fairly stable, althou
- Page 116 and 117:
languages. The fact that more mothe
- Page 118 and 119:
In interpreting these results, it s
- Page 120 and 121:
Overall, mothers reported seeking h
- Page 122 and 123:
We found that in years 2 and 3, aft
- Page 124 and 125:
We also found that mothers tended t
- Page 126 and 127:
variables that could potentially be
- Page 128 and 129:
significant levels of stress. Paren
- Page 130 and 131:
positive parenting items and 5 nega
- Page 132 and 133:
friend/neighbor/other), which were
- Page 134 and 135:
Table 60. Logistic Regression of Ch
- Page 136 and 137:
Table 62. Logistic Regression of Ch
- Page 138 and 139:
Table 64. Logistic Regression of Ch
- Page 140 and 141:
County in either fall 2009 or fall
- Page 142 and 143:
Figure 6. Percent of Focal Children
- Page 144 and 145:
Next, we conducted logistic regress
- Page 146 and 147:
Table 68. Selected Maternal and Chi
- Page 148 and 149:
R 2 .180*p < .05, **p < .01, or ***
- Page 150 and 151:
SummarySimilar to previous analyses
- Page 152 and 153:
less than a high school education,
- Page 154 and 155:
Parenting PracticesWhen surveyed in
- Page 156 and 157:
We also looked at the stability of
- Page 158 and 159:
Service Use, Maternal Functioning,
- Page 160 and 161:
Conclusions and ImplicationsMore th
- Page 162 and 163:
Meanwhile, our findings indicate th
- Page 164 and 165:
literacy skills, families who do no
- Page 166 and 167:
BibliographyAbidin, R. R. (1995). P
- Page 168 and 169:
Dinan, K. A. (2005a). Federal polic
- Page 170 and 171:
Leventhal, T., Brooks-Gunn, J., McC
- Page 172 and 173:
Weisner, T. S. (1984). A cross-cult
- Page 174 and 175: What are pathways to service use? W
- Page 176 and 177: Table A- 1. FOCiS Codes for MCHP Se
- Page 178 and 179: Table A- 2. Interview Study Samplin
- Page 180 and 181: Table A- 3. Household Survey Topics
- Page 182 and 183: Table A- 5. Reasons for Sample Attr
- Page 184 and 185: we sought to identify the ecologica
- Page 186 and 187: Table B- 2. Characteritics of TGA M
- Page 188 and 189: Figure B- 1. Characteristics of Mot
- Page 190 and 191: Figure B- 3. Characteristics of Mot
- Page 192 and 193: Figure B- 5. Percentage of PBC Moth
- Page 194 and 195: Table B- 5. Logistic Regression Pre
- Page 196 and 197: Figure B- 7. Characteristics of Mot
- Page 198 and 199: Table B- 7. Characteristics of TGA
- Page 200 and 201: Table B- 9. Logistic Regression Pre
- Page 202 and 203: Type of Enhanced Service2009N% of M
- Page 204 and 205: Table B- 12. Logistic Regression Pr
- Page 206 and 207: Numberof BirthswithReferrals2009 TG
- Page 208 and 209: Table B- 15. OLS Logistic Regressio
- Page 210 and 211: Table C- 1. Selected Characteristic
- Page 212 and 213: Table C- 4. Social and Emotional Be
- Page 214 and 215: Table C- 7. Communication Skills of
- Page 216 and 217: Table C- 11. Emerging Literacy and
- Page 218 and 219: Table C- 14. Mothers’ Negative Pa
- Page 220 and 221: Number of Different Arrangements ac
- Page 222 and 223: Figure C- 1. Mean Days of MCHP Serv
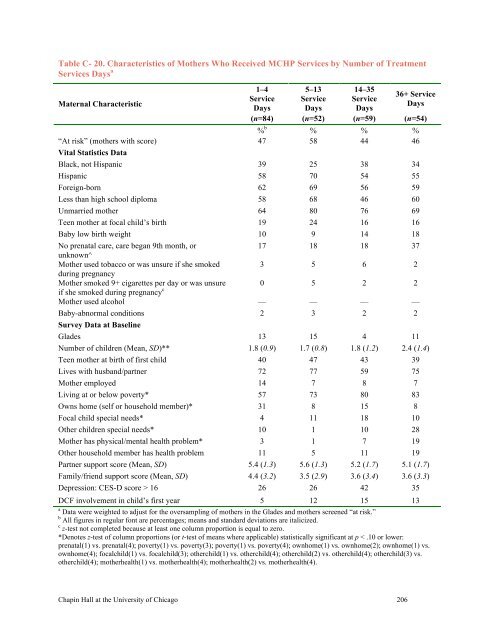
- Page 226 and 227: Table C- 22. Number of Service Area
- Page 228 and 229: Table C- 23. Number of Services Use
- Page 230 and 231: Table C- 25. Linear Regression Anal
- Page 232 and 233: Table C- 27. Baseline Characteristi


