

ECOPROBE 5 - rs dynamics
ECOPROBE 5 - rs dynamics
ECOPROBE 5 - rs dynamics

You also want an ePaper? Increase the reach of your titles
YUMPU automatically turns print PDFs into web optimized ePapers that Google loves.
Data collected in the field can be easily transferred by <strong>ECOPROBE</strong>_VIEW communication software from<br />
<strong>ECOPROBE</strong> 5 to the computer.There are two ve<strong>rs</strong>ions of the communication software – Light and Plus.<br />
Plus ve<strong>rs</strong>ion comprises additional optional features. Only basic information about data logging and data<br />
interpretation is discussed here as <strong>ECOPROBE</strong>_VIEW software is described in the software manual.<br />
The <strong>ECOPROBE</strong> 5 provides standard surface data logging and optional GPS logging. Both allow freedom of<br />
movement between any station at a specific locality. All data are stored in the instrument’s memory according<br />
to the surface X ,Y or GPS coordinates. This system of data logging represents a powerful tool for obtaining<br />
interpretation results promptly.<br />
The <strong>ECOPROBE</strong>_VIEW software ensures user-friendly data transfer from the instrument to the computer<br />
providing basic graphic data interpretation and a data spreadsheet. A data spreadsheet is created from all the<br />
data which are saved according to the coordinates.<br />
For obtaining contour and wire-frame maps of contamination the user needs graphic software Surfer (Golden<br />
Software) and proceed according to the Surfer manual. Surfer can directly use the spreadsheet values for<br />
obtaining contour and wire-frame maps in a very short time.<br />
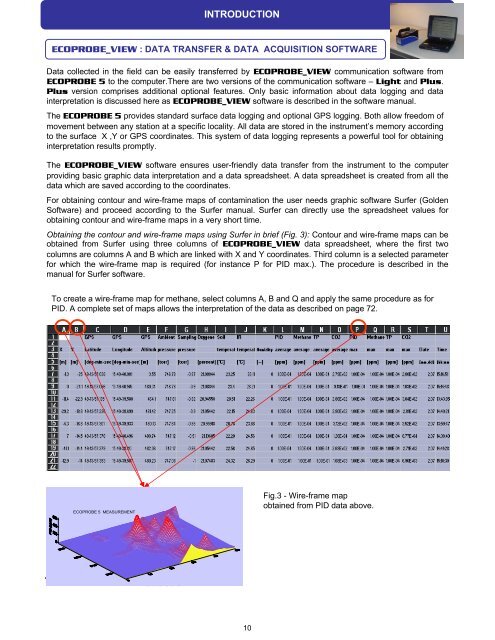
Obtaining the contour and wire-frame maps using Surfer in brief (Fig. 3): Contour and wire-frame maps can be<br />
obtained from Surfer using three columns of <strong>ECOPROBE</strong>_VIEW data spreadsheet, where the fi<strong>rs</strong>t two<br />
columns are columns A and B which are linked with X and Y coordinates. Third column is a selected parameter<br />
for which the wire-frame map is required (for instance P for PID max.). The procedure is described in the<br />
manual for Surfer software.<br />
To create a wire-frame map for methane, select columns A, B and Q and apply the same procedure as for<br />
PID. A complete set of maps allows the interpretation of the data as described on page 72.<br />
<strong>ECOPROBE</strong> 5 MEASUREMENT<br />
INTRODUCTION<br />
<strong>ECOPROBE</strong>_VIEW : DATA TRANSFER & DATA ACQUISITION SOFTWARE<br />
10<br />
Fig.3 - Wire-frame map<br />
obtained from PID data above.