

ECOPROBE 5 - rs dynamics
ECOPROBE 5 - rs dynamics
ECOPROBE 5 - rs dynamics

Create successful ePaper yourself
Turn your PDF publications into a flip-book with our unique Google optimized e-Paper software.
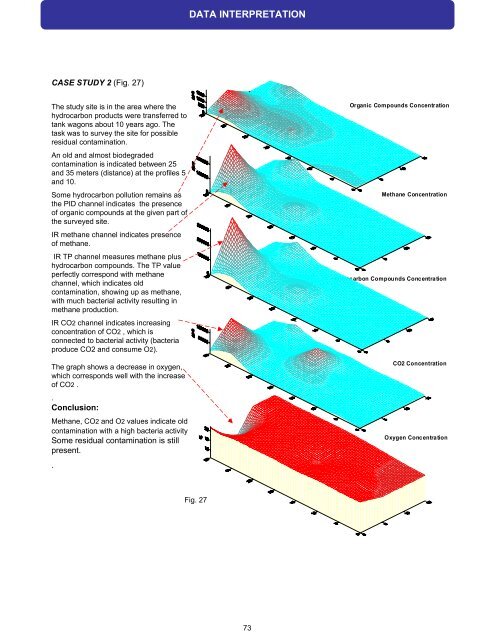
CASE STUDY 2 (Fig. 27)<br />
The study site is in the area where the<br />
hydrocarbon products were transferred to<br />
tank wagons about 10 yea<strong>rs</strong> ago. The<br />
task was to survey the site for possible<br />
residual contamination.<br />
An old and almost biodegraded<br />
contamination is indicated between 25<br />
and 35 mete<strong>rs</strong> (distance) at the profiles 5<br />
and 10.<br />
Some hydrocarbon pollution remains as<br />
the PID channel indicates the presence<br />
of organic compounds at the given part of<br />
the surveyed site.<br />
IR methane channel indicates presence<br />
of methane.<br />
IR TP channel measures methane plus<br />
hydrocarbon compounds. The TP value<br />
perfectly correspond with methane<br />
channel, which indicates old<br />
contamination, showing up as methane,<br />
with much bacterial activity resulting in<br />
methane production.<br />
IR CO2 channel indicates increasing<br />
concentration of CO2 , which is<br />
connected to bacterial activity (bacteria<br />
produce CO2 and consume O2).<br />
The graph shows a decrease in oxygen,<br />
which corresponds well with the increase<br />
of CO2 .<br />
.<br />
Conclusion:<br />
Methane, CO2 and O2 values indicate old<br />
contamination with a high bacteria activity<br />
Some residual contamination is still<br />
present.<br />
.<br />
DATA INTERPRETATION<br />
Fig. 27<br />
73<br />
Organic Compounds Concentration<br />
Methane Concentration<br />
Hydrocarbon Compounds Concentration<br />
CO2 Concentration<br />
Oxygen Concentration