

ECOPROBE 5 - rs dynamics
ECOPROBE 5 - rs dynamics
ECOPROBE 5 - rs dynamics

Create successful ePaper yourself
Turn your PDF publications into a flip-book with our unique Google optimized e-Paper software.
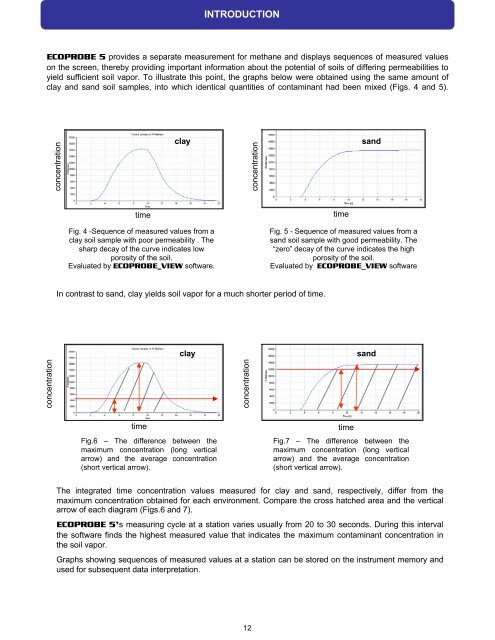
<strong>ECOPROBE</strong> 5 provides a separate measurement for methane and displays sequences of measured values<br />
on the screen, thereby providing important information about the potential of soils of differing permeabilities to<br />
yield sufficient soil vapor. To illustrate this point, the graphs below were obtained using the same amount of<br />
clay and sand soil samples, into which identical quantities of contaminant had been mixed (Figs. 4 and 5).<br />
concentration<br />
concentration<br />
time<br />
Fig. 4 -Sequence of measured values from a<br />
clay soil sample with poor permeability . The<br />
sharp decay of the curve indicates low<br />
porosity of the soil.<br />
Evaluated by <strong>ECOPROBE</strong>_VIEW software.<br />
INTRODUCTION<br />
In contrast to sand, clay yields soil vapor for a much shorter period of time.<br />
time<br />
Fig.6 – The difference between the<br />
maximum concentration (long vertical<br />
arrow) and the average concentration<br />
(short vertical arrow).<br />
clay sand<br />
concentration<br />
12<br />
concentration<br />
Fig. 5 - Sequence of measured values from a<br />
sand soil sample with good permeability. The<br />
“zero” decay of the curve indicates the high<br />
porosity of the soil.<br />
Evaluated by <strong>ECOPROBE</strong>_VIEW software<br />
The integrated time concentration values measured for clay and sand, respectively, differ from the<br />
maximum concentration obtained for each environment. Compare the cross hatched area and the vertical<br />
arrow of each diagram (Figs.6 and 7).<br />
<strong>ECOPROBE</strong> 5’s measuring cycle at a station varies usually from 20 to 30 seconds. During this interval<br />
the software finds the highest measured value that indicates the maximum contaminant concentration in<br />
the soil vapor.<br />
Graphs showing sequences of measured values at a station can be stored on the instrument memory and<br />
used for subsequent data interpretation.<br />
time<br />
clay sand<br />
time<br />
Fig.7 – The difference between the<br />
maximum concentration (long vertical<br />
arrow) and the average concentration<br />
(short vertical arrow).