

ECOPROBE 5 - rs dynamics
ECOPROBE 5 - rs dynamics
ECOPROBE 5 - rs dynamics

You also want an ePaper? Increase the reach of your titles
YUMPU automatically turns print PDFs into web optimized ePapers that Google loves.
PID ANALYZER<br />
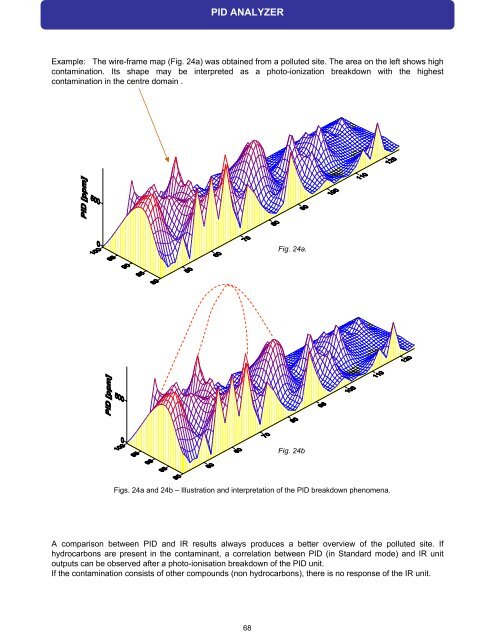
Example: The wire-frame map (Fig. 24a) was obtained from a polluted site. The area on the left shows high<br />
contamination. Its shape may be interpreted as a photo-ionization breakdown with the highest<br />
contamination in the centre domain .<br />
Figs. 24a and 24b – Illustration and interpretation of the PID breakdown phenomena.<br />
A comparison between PID and IR results always produces a better overview of the polluted site. If<br />
hydrocarbons are present in the contaminant, a correlation between PID (in Standard mode) and IR unit<br />
outputs can be observed after a photo-ionisation breakdown of the PID unit.<br />
If the contamination consists of other compounds (non hydrocarbons), there is no response of the IR unit.<br />
68<br />
Fig. 24a.<br />
Fig. 24b