

ECOPROBE 5 - rs dynamics
ECOPROBE 5 - rs dynamics
ECOPROBE 5 - rs dynamics

Create successful ePaper yourself
Turn your PDF publications into a flip-book with our unique Google optimized e-Paper software.
3.2 GRID<br />
Standard<br />
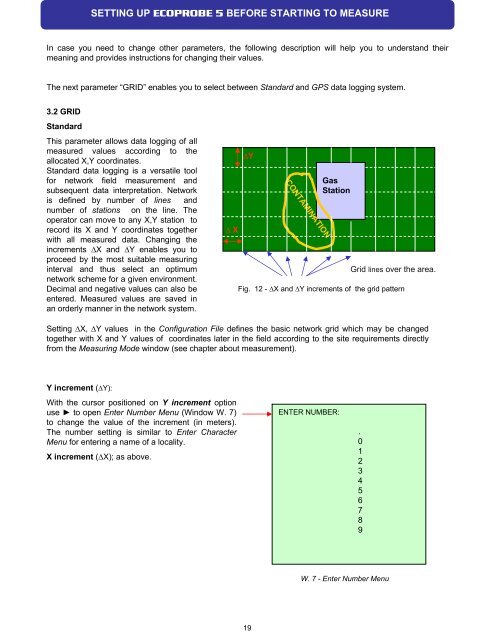
This parameter allows data logging of all<br />
measured values according to the<br />
allocated X,Y coordinates.<br />
Standard data logging is a ve<strong>rs</strong>atile tool<br />
for network field measurement and<br />
subsequent data interpretation. Network<br />
is defined by number of lines and<br />
number of stations on the line. The<br />
operator can move to any X,Y station to<br />
record its X and Y coordinates together<br />
with all measured data. Changing the<br />
increments ∆X and ∆Y enables you to<br />
proceed by the most suitable measuring<br />
interval and thus select an optimum<br />
network scheme for a given environment.<br />
Decimal and negative values can also be<br />
entered. Measured values are saved in<br />
an orderly manner in the network system.<br />
Y increment (∆Y):<br />
SETTING UP <strong>ECOPROBE</strong> 5 BEFORE STARTING TO MEASURE<br />
In case you need to change other paramete<strong>rs</strong>, the following description will help you to unde<strong>rs</strong>tand their<br />
meaning and provides instructions for changing their values.<br />
The next parameter “GRID” enables you to select between Standard and GPS data logging system.<br />
∆ X<br />
Setting ∆X, ∆Y values in the Configuration File defines the basic network grid which may be changed<br />
together with X and Y values of coordinates later in the field according to the site requirements directly<br />
from the Measuring Mode window (see chapter about measurement).<br />
With the cu<strong>rs</strong>or positioned on Y increment option<br />
use ► to open Enter Number Menu (Window W. 7)<br />
to change the value of the increment (in mete<strong>rs</strong>).<br />
The number setting is similar to Enter Character<br />
Menu for entering a name of a locality.<br />
X increment (∆X); as above.<br />
∆Y<br />
19<br />
CONTAMINATION<br />
Gas<br />
Station<br />
ENTER NUMBER:<br />
.<br />
0<br />
1<br />
2<br />
3<br />
4<br />
5<br />
6<br />
7<br />
8<br />
9<br />
W. 7 - Enter Number Menu<br />
Grid lines over the area.<br />
Fig. 12 - ∆X and ∆Y increments of the grid pattern