ECOPROBE 5 - rs dynamics
ECOPROBE 5 - rs dynamics
ECOPROBE 5 - rs dynamics
Create successful ePaper yourself
Turn your PDF publications into a flip-book with our unique Google optimized e-Paper software.
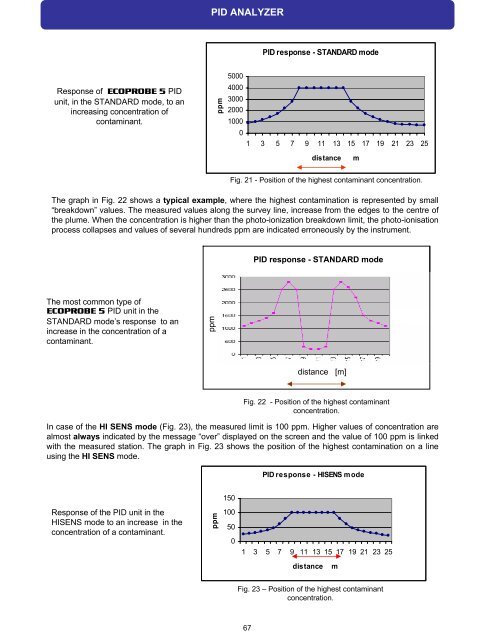
Response of <strong>ECOPROBE</strong> 5 PID<br />
unit, in the STANDARD mode, to an<br />
increasing concentration of<br />
contaminant.<br />
The most common type of<br />
<strong>ECOPROBE</strong> 5 PID unit in the<br />
STANDARD mode’s response to an<br />
increase in the concentration of a<br />
contaminant.<br />
ppm<br />
5000<br />
4000<br />
3000<br />
2000<br />
1000<br />
Fig. 21 - Position of the highest contaminant concentration.<br />
67<br />
PID response - STANDARD mode<br />
0<br />
1 3 5 7 9 11 13 15 17 19 21 23 25<br />
distance m<br />
The graph in Fig. 22 shows a typical example, where the highest contamination is represented by small<br />
“breakdown” values. The measured values along the survey line, increase from the edges to the centre of<br />
the plume. When the concentration is higher than the photo-ionization breakdown limit, the photo-ionisation<br />
process collapses and values of several hundreds ppm are indicated erroneously by the instrument.<br />
ppm<br />
PID response - STANDARD mode<br />
distance [m]<br />
Fig. 22 - Position of the highest contaminant<br />
concentration.<br />
In case of the HI SENS mode (Fig. 23), the measured limit is 100 ppm. Higher values of concentration are<br />
almost always indicated by the message “over” displayed on the screen and the value of 100 ppm is linked<br />
with the measured station. The graph in Fig. 23 shows the position of the highest contamination on a line<br />
using the HI SENS mode.<br />
Response of the PID unit in the<br />
HISENS mode to an increase in the<br />
concentration of a contaminant.<br />
PID ANALYZER<br />
ppm<br />
150<br />
100<br />
50<br />
0<br />
PID response - HISENS mode<br />
1 3 5 7 9 11 13 15 17 19 21 23 25<br />
distance m<br />
Fig. 23 – Position of the highest contaminant<br />
concentration.


