- Page 1 and 2:
WIND TURBINE DESIGN
- Page 3 and 4:
ABSTRACT At the request of the Engi
- Page 5 and 6:
CONTENTS 1 Introduction ...........
- Page 7 and 8:
E Structural analysis of blades ...
- Page 9 and 10:
INTRODUCTION members. Today EWB-DK
- Page 11 and 12:
INTRODUCTION Figure 1.2: Left pictu
- Page 13 and 14:
INTRODUCTION 6
- Page 15 and 16:
PROBLEM STATEMENT reconfigured with
- Page 17 and 18:
PROBLEM STATEMENT 10
- Page 19 and 20:
METHODOLOGY Figure 3.1: Flow chart
- Page 21 and 22:
METHODOLOGY 14 3.1 Calculation meth
- Page 23 and 24:
CONCEPTUALISATION the kinetic wind
- Page 25 and 26:
CONCEPTUALISATION Figure 4.3: (a) D
- Page 27 and 28:
CONCEPTUALISATION issues due to tur
- Page 29 and 30:
CONCEPTUALISATION 22 Figure 4.8: Ty
- Page 31 and 32:
CONCEPTUALISATION � Darrieus 24 F
- Page 33 and 34:
CONCEPTUALISATION 26 Figure 4.13: G
- Page 35 and 36:
CONCEPTUALISATION Figure 4.14: Powe
- Page 37 and 38:
CONCEPTUALISATION 30 ID Requirement
- Page 39 and 40:
CONCEPTUALISATION most suitable sol
- Page 41 and 42:
CONCEPTUALISATION The embodiment de
- Page 43 and 44:
DESIGN PRESENTATION The main dimens
- Page 45 and 46:
DESIGN PRESENTATION The design prop
- Page 47 and 48:
DESIGN PRESENTATION The background
- Page 49 and 50:
ROTOR 42 6.1 Number of blades Moder
- Page 51 and 52:
ROTOR 44 Figure 6.4: Blade design s
- Page 53 and 54:
ROTOR Table 6.3 provides a material
- Page 55 and 56:
ROTOR Figure 6.7 displays the lift
- Page 57 and 58:
ROTOR Figure 6.9: Rotor power outpu
- Page 59 and 60:
ROTOR 6.2.3 Manufacturing During th
- Page 61 and 62:
ROTOR 54 The three sides of the tem
- Page 63 and 64:
ROTOR When the carving process is f
- Page 65 and 66:
ROTOR 58 Figure 6.17: Blade attachm
- Page 67 and 68:
ROTOR 60 Figure 6.19: Rotor power o
- Page 69 and 70:
ROTOR 62 Figure 6.22: Efficiency
- Page 71 and 72:
ROTOR sidering the output from the
- Page 73 and 74:
ROTOR 66
- Page 75 and 76:
GENERATOR AND ELECTRICAL SYSTEM 68
- Page 77 and 78:
GENERATOR AND ELECTRICAL SYSTEM The
- Page 79 and 80:
GENERATOR AND ELECTRICAL SYSTEM Fig
- Page 81 and 82:
GENERATOR AND ELECTRICAL SYSTEM 74
- Page 83 and 84:
YAW AND FURLING For an upwind wind
- Page 85 and 86:
YAW AND FURLING (16), which are bol
- Page 87 and 88:
YAW AND FURLING 80 8.2 Furling syst
- Page 89 and 90:
YAW AND FURLING 82 8.3 Summary The
- Page 91 and 92:
TOWER Concrete tower 84 Figure 9.1:
- Page 93 and 94:
TOWER 86 Figure 9.4: Turbulent air
- Page 95 and 96:
TOWER Figure 9.7 shows the tower ba
- Page 97 and 98:
TOWER models [41, p. 111]. Under ce
- Page 99 and 100:
ALTERNATIVE BLADE DESIGN 92 10.1 Ai
- Page 101 and 102:
ALTERNATIVE BLADE DESIGN 94 10.3 Su
- Page 103 and 104:
DESIGN EVALUATION 96 6 W Low-cost m
- Page 105 and 106:
DESIGN EVALUATION Weaknesses 1) The
- Page 107 and 108:
FURTHER DEVELOPMENT � Foundation
- Page 109 and 110:
FURTHER DEVELOPMENT 102
- Page 111 and 112:
CONCLUSION proposal is highly flexi
- Page 113 and 114:
NOMENCLATURE Abbreviation Descripti
- Page 115 and 116:
NOMENCLATURE Lgs Distance between u
- Page 117 and 118:
NOMENCLATURE 110
- Page 119 and 120:
BIBLIOGRAPHY [14] Magenn Power Inc.
- Page 121 and 122:
BIBLIOGRAPHY [53] H. J. Larsen, H.
- Page 123 and 124:
LIST OF ATTACHMENTSBASIS FOR CALCUL
- Page 125 and 126:
LIST OF ATTACHMENTSBASIS FOR CALCUL
- Page 127 and 128:
LIST OF ATTACHMENTSBASIS FOR CALCUL
- Page 129 and 130:
LIST OF ATTACHMENTSBASIS FOR CALCUL
- Page 131 and 132:
LIST OF ATTACHMENTSBASIS FOR CALCUL
- Page 133 and 134:
LIST OF ATTACHMENTSBASIS FOR CALCUL
- Page 135 and 136:
LIST OF ATTACHMENTSBASIS FOR CALCUL
- Page 137 and 138:
LIST OF ATTACHMENTSBASIS FOR CALCUL
- Page 139 and 140:
LIST OF ATTACHMENTSROTOR THEORY Thi
- Page 141 and 142:
LIST OF ATTACHMENTSROTOR THEORY 134
- Page 143 and 144:
LIST OF ATTACHMENTSROTOR THEORY Cho
- Page 145 and 146:
LIST OF ATTACHMENTSROTOR THEORY 138
- Page 147 and 148:
LIST OF ATTACHMENTSROTOR DESIGN TOO
- Page 149 and 150:
LIST OF ATTACHMENTSROTOR DESIGN TOO
- Page 151 and 152:
LIST OF ATTACHMENTSAIRFOIL With the
- Page 153 and 154:
LIST OF ATTACHMENTSAIRFOIL Complete
- Page 155 and 156:
LIST OF ATTACHMENTSSTRUCTURAL ANALY
- Page 157 and 158:
LIST OF ATTACHMENTSSTRUCTURAL ANALY
- Page 159 and 160:
LIST OF ATTACHMENTSSTRUCTURAL ANALY
- Page 161 and 162:
LIST OF ATTACHMENTSSTRUCTURAL ANALY
- Page 163 and 164:
LIST OF ATTACHMENTSSTRUCTURAL ANALY
- Page 165 and 166:
LIST OF ATTACHMENTSSTRUCTURAL ANALY
- Page 167 and 168:
LIST OF ATTACHMENTSSTRUCTURAL ANALY
- Page 169 and 170:
LIST OF ATTACHMENTSSTRUCTURAL ANALY
- Page 171 and 172:
LIST OF ATTACHMENTSSTRUCTURAL ANALY
- Page 173 and 174:
LIST OF ATTACHMENTSSTRUCTURAL ANALY
- Page 175 and 176: LIST OF ATTACHMENTSSTRUCTURAL ANALY
- Page 177 and 178: LIST OF ATTACHMENTSSTRUCTURAL ANALY
- Page 179 and 180: LIST OF ATTACHMENTSSTRUCTURAL ANALY
- Page 181 and 182: LIST OF ATTACHMENTSSTRUCTURAL ANALY
- Page 183 and 184: LIST OF ATTACHMENTSSTRUCTURAL ANALY
- Page 185 and 186: LIST OF ATTACHMENTSSTRUCTURAL ANALY
- Page 187 and 188: LIST OF ATTACHMENTSSTRUCTURAL ANALY
- Page 189 and 190: LIST OF ATTACHMENTSSTRUCTURAL ANALY
- Page 191 and 192: LIST OF ATTACHMENTSBLADE ATTACHMENT
- Page 193 and 194: LIST OF ATTACHMENTSBLADE ATTACHMENT
- Page 195 and 196: LIST OF ATTACHMENTSBLADE ATTACHMENT
- Page 197 and 198: LIST OF ATTACHMENTSSTRUCTURAL VERIF
- Page 199 and 200: LIST OF ATTACHMENTSSTRUCTURAL VERIF
- Page 201 and 202: LIST OF ATTACHMENTSSTRUCTURAL VERIF
- Page 203 and 204: LIST OF ATTACHMENTSTOWER ANALYSIS T
- Page 205 and 206: LIST OF ATTACHMENTSTOWER ANALYSIS T
- Page 207 and 208: LIST OF ATTACHMENTSTOWER ANALYSIS T
- Page 209 and 210: LIST OF ATTACHMENTSFURLING AND YAW
- Page 211 and 212: LIST OF ATTACHMENTSFURLING AND YAW
- Page 213 and 214: LIST OF ATTACHMENTSFURLING AND YAW
- Page 215 and 216: LIST OF ATTACHMENTSFURLING AND YAW
- Page 217 and 218: LIST OF ATTACHMENTSFURLING AND YAW
- Page 219 and 220: LIST OF ATTACHMENTSFURLING AND YAW
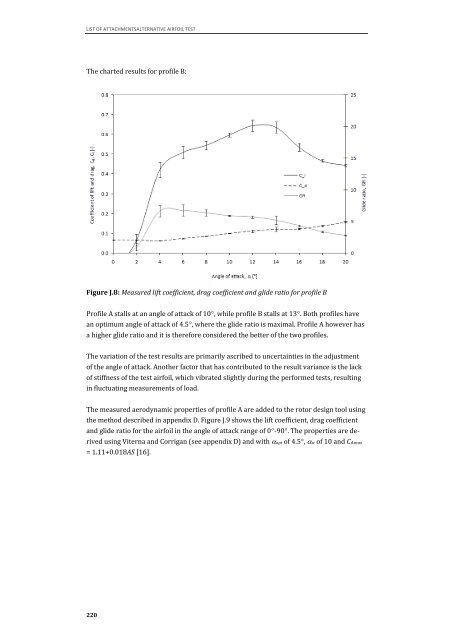
- Page 221 and 222: LIST OF ATTACHMENTSALTERNATIVE AIRF
- Page 223 and 224: LIST OF ATTACHMENTSALTERNATIVE AIRF
- Page 225: LIST OF ATTACHMENTSALTERNATIVE AIRF
- Page 229 and 230: LIST OF ATTACHMENTSALTERNATIVE AIRF
- Page 231: LIST OF ATTACHMENTSCOMPLIANCE WITH