Nkomazi Local Municipality 20 - Co-operative Governance and ...
Nkomazi Local Municipality 20 - Co-operative Governance and ...
Nkomazi Local Municipality 20 - Co-operative Governance and ...
- No tags were found...

You also want an ePaper? Increase the reach of your titles
YUMPU automatically turns print PDFs into web optimized ePapers that Google loves.
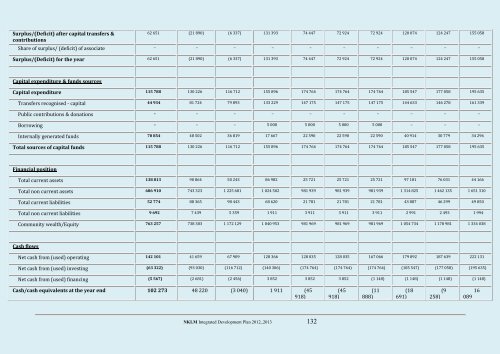
Surplus/(Deficit) after capital transfers &contributions62 651 (21 890) (6 337) 131 393 74 447 72 924 72 924 1<strong>20</strong> 074 124 247 155 058Share of surplus/ (deficit) of associate – – – – – – – – – –Surplus/(Deficit) for the year 62 651 (21 890) (6 337) 131 393 74 447 72 924 72 924 1<strong>20</strong> 074 124 247 155 058Capital expenditure & funds sourcesCapital expenditure 115 788 130 226 116 712 155 896 174 764 174 764 174 764 185 547 177 058 195 635Transfers recognised - capital 44 934 81 724 79 893 133 229 147 175 147 175 147 175 144 633 146 278 161 339Public contributions & donations – – – – – – – – – –Borrowing – – – 5 000 5 000 5 000 5 000 – – –Internally generated funds 70 854 48 502 36 819 17 667 22 590 22 590 22 590 40 914 30 779 34 296Total sources of capital funds 115 788 130 226 116 712 155 896 174 764 174 764 174 764 185 547 177 058 195 635Financial positionTotal current assets 138 813 90 864 50 243 86 982 25 721 25 721 25 721 97 181 76 031 44 166Total non current assets 686 910 743 323 1 225 681 1 024 502 981 939 981 939 981 939 1 314 825 1 462 135 1 651 310Total current liabilities 52 774 88 365 98 443 68 6<strong>20</strong> 21 781 21 781 21 781 43 887 46 299 49 050Total non current liabilities 9 692 7 439 5 359 1 911 3 911 3 911 3 911 2 991 2 493 1 994<strong>Co</strong>mmunity wealth/Equity 763 257 738 383 1 172 129 1 040 953 981 969 981 969 981 969 1 054 734 1 178 981 1 334 038Cash flowsNet cash from (used) operating 142 101 41 659 67 909 128 366 128 035 128 035 167 066 179 892 187 639 222 131Net cash from (used) investing (63 322) (93 030) (116 712) (140 306) (174 764) (174 764) (174 764) (185 547) (177 058) (195 635)Net cash from (used) financing (5 567) (2 681) (2 456) 3 852 3 852 3 852 (1 148) (1 148) (1 148) (1 148)Cash/cash equivalents at the year end 102 273 48 2<strong>20</strong> (3 040) 1 911 (45918)(45918)(11888)(18691)(9258)16089NKLM Integrated Development Plan <strong>20</strong>12_<strong>20</strong>13 132