Nkomazi Local Municipality 20 - Co-operative Governance and ...
Nkomazi Local Municipality 20 - Co-operative Governance and ...
Nkomazi Local Municipality 20 - Co-operative Governance and ...
- No tags were found...

Create successful ePaper yourself
Turn your PDF publications into a flip-book with our unique Google optimized e-Paper software.
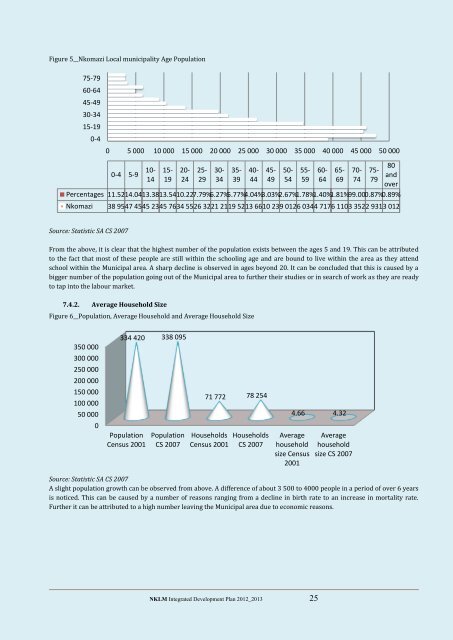
Figure 5__<strong>Nkomazi</strong> <strong>Local</strong> municipality Age Population75-7960-6445-4930-3415-190-40 5 000 10 000 15 000 <strong>20</strong> 000 25 000 30 000 35 000 40 000 45 000 50 0008010- 15- <strong>20</strong>- 25- 30- 35- 40- 45- 50- 55- 60- 65- 70- 75-0-4 5-9<strong>and</strong>14 19 24 29 34 39 44 49 54 59 64 69 74 79overPercentages 11.5214.0413.3813.5410.227.79% 6.27% 5.77% 4.04% 3.03% 2.67% 1.78% 1.40% 1.81% 99.000.87% 0.89%<strong>Nkomazi</strong> 38 95 47 45 45 23 45 76 34 55 26 32 21 21 19 52 13 66 10 23 9 012 6 034 4 717 6 110 3 352 2 931 3 012Source: Statistic SA CS <strong>20</strong>07From the above, it is clear that the highest number of the population exists between the ages 5 <strong>and</strong> 19. This can be attributedto the fact that most of these people are still within the schooling age <strong>and</strong> are bound to live within the area as they attendschool within the Municipal area. A sharp decline is observed in ages beyond <strong>20</strong>. It can be concluded that this is caused by abigger number of the population going out of the Municipal area to further their studies or in search of work as they are readyto tap into the labour market.7.4.2. Average Household SizeFigure 6__Population, Average Household <strong>and</strong> Average Household Size350 000300 000250 000<strong>20</strong>0 000150 000100 00050 0000334 4<strong>20</strong> 338 095PopulationCensus <strong>20</strong>01PopulationCS <strong>20</strong>0771 772 78 254HouseholdsCensus <strong>20</strong>01HouseholdsCS <strong>20</strong>074.66 4.32Averagehouseholdsize Census<strong>20</strong>01Averagehouseholdsize CS <strong>20</strong>07Source: Statistic SA CS <strong>20</strong>07A slight population growth can be observed from above. A difference of about 3 500 to 4000 people in a period of over 6 yearsis noticed. This can be caused by a number of reasons ranging from a decline in birth rate to an increase in mortality rate.Further it can be attributed to a high number leaving the Municipal area due to economic reasons.NKLM Integrated Development Plan <strong>20</strong>12_<strong>20</strong>13 25