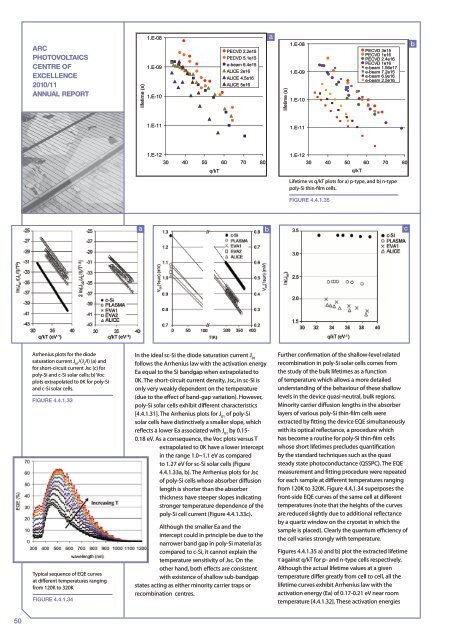
ARCPHOTOVOLTAICSCENTRE OFEXCELLENCE2010/11ANNUAL REPORTlifetime (s)1.E-081.E-091.E-10PECVD 2.2e15PECVD 5.1e15e-beam 6.4e15ALICE 2e16ALICE 4.5e16ALICE 5e16lifetime (s)1.E-081.E-091.E-10PECVD 3e15PECVD 1e16PECVD 2.4e16PECVD 1e16e-beam 1.56e17e-beam 7.2e15e-beam 6.9e16e-beam 2.5e161.E-111.E-111.E-1230 40 50 60 70 80q/kT1.E-1230 40 50 60 70 80q/kTLifetime vs q/kT plots for a) p-type, and b) n-typepoly-Si thin-film cells.Figure 4.4.1.35Arrhenius plots for the diodesaturation current J 01/(J L/I) (a) andfor short-circuit current Jsc (c) forpoly-Si and c-Si solar cells; b) Vocplots extrapolated to 0K for poly-Siand c-Si solar cells.Figure 4.4.1.33Typical sequence <strong>of</strong> EQE curvesat different temperatures rangingfrom 120K to 320KFigure 4.4.1.34In the ideal sc-Si the diode saturation current J 01follows the Arrhenius law with the activation energyEa equal to the Si bandgap when extrapolated to0K. The short-circuit current density, Jsc, in sc-Si isonly very weakly dependent on the temperature(due to the effect <strong>of</strong> band-gap variation). However,poly-Si solar cells exhibit different characteristics[4.4.1.31]. The Arrhenius plots for J 01<strong>of</strong> poly-Sisolar cells have distinctively a smaller slope, whichreflects a lower Ea associated with J 01by 0.15-0.18 eV. As a consequence, the Voc plots versus Textrapolated to 0K have a lower interceptin the range 1.0~1.1 eV as comparedto 1.27 eV for sc-Si solar cells (Figure4.4.1.33a, b). The Arrhenius plots for Jsc<strong>of</strong> poly-Si cells whose absorber diffusionlength is shorter than the absorberthickness have steeper slopes indicatingstronger temperature dependence <strong>of</strong> thepoly-Si cell current (Figure 4.4.1.33c).Although the smaller Ea and theintercept could in principle be due to thenarrower band gap in poly-Si material ascompared to c-Si, it cannot explain thetemperature sensitivity <strong>of</strong> Jsc. On theother hand, both effects are consistentwith existence <strong>of</strong> shallow sub-bandgapstates acting as either minority carrier traps orrecombination centres.Further confirmation <strong>of</strong> the shallow-level relatedrecombination in poly-Si solar cells comes fromthe study <strong>of</strong> the bulk lifetimes as a function<strong>of</strong> temperature which allows a more detailedunderstanding <strong>of</strong> the behaviour <strong>of</strong> these shallowlevels in the device quasi-neutral, bulk regions.Minority carrier diffusion lengths in the absorberlayers <strong>of</strong> various poly-Si thin-film cells wereextracted by fitting the device EQE simultaneouslywith its optical reflectance, a procedure whichhas become a routine for poly-Si thin-film cellswhose short lifetimes precludes quantificationby the standard techniques such as the quasisteady state photoconductance (QSSPC). The EQEmeasurement and fitting procedure were repeatedfor each sample at different temperatures rangingfrom 120K to 320K. Figure 4.4.1.34 superposes thefront-side EQE curves <strong>of</strong> the same cell at differenttemperatures (note that the heights <strong>of</strong> the curvesare reduced slightly due to additional reflectanceby a quartz window on the cryostat in which thesample is placed). Clearly the quantum efficiency <strong>of</strong>the cell varies strongly with temperature.Figures 4.4.1.35 a) and b) plot the extracted lifetimeτ against q/kT for p- and n-type cells respectively.Although the actual lifetime values at a giventemperature differ greatly from cell to cell, all thelifetime curves exhibit Arrhenius law with theactivation energy (Ea) <strong>of</strong> 0.17-0.21 eV near roomtemperature [4.4.1.32]. These activation energies50
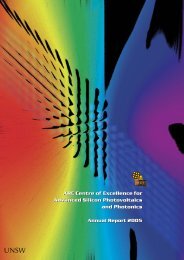
ARCPHOTOVOLTAICSCENTRE OFEXCELLENCE2010/11ANNUAL REPORTTypical TEM DFWB image <strong>of</strong> a poly-Si film on glass.0.5 μmFigure 4.4.1.37are much larger than those reported for plasticallydeformed Si and multicrystalline Si [4.4.1.35],where the dominant recombination is thoughtto be via transitions between the shallow anddeep levels. Assuming direct transitions betweenshallow levels, the Ea is expected to be (Ec-E de)+(E dh-Ev)+2.5kT=180~120 meV (where E deand E dhareshallow band energies near the conduction and thevalence bands respectively), which is in remarkableagreement with the experimental values.Furthermore, as a consequence <strong>of</strong> electrontransitions between the shallow bands, therecombination rate becomes proportional to theconcentrations <strong>of</strong> both minority and majoritycarriers, as in the case <strong>of</strong> radiative recombination,in contrast to recombination via deep levels,where the rate is proportional to the minoritycarrier concentration only. It leads to minoritycarrier lifetime inversely proportional to themajority carrier concentration, or roughly to thedopant concentration [4.4.1.32]. The experimentalconfirmation <strong>of</strong> this effect is shown in Figure4.4.1.36 which plots the minority carrier lifetimesin a number <strong>of</strong> poly-Si solar cells versus the dopantdensity. There is a clear inverse relationshipbetween the lifetime and dopant density.Amongst the n-type cells in Figure 4.4.1.35b, threeare made from small grained (~1 μm) poly-Si (circleor square data points), and three are made fromlarge grained (~5 μm) poly-Si epitaxially grown onan Al induced crystallised (AIC) seed layer (triangledata points). The similarity in the temperaturebehaviour <strong>of</strong> the lifetime, regardless <strong>of</strong> the grainsize, indicates that large and small grain materialshave a common lifetime limiting mechanism. Also,in Figure 4.4.1.36 one readily sees that the AIC cells(triangles) can take on the lifetime values eitherabove or below the power law trend line, indicatingthat they do not have consistently superior lifetimesjust by virtue <strong>of</strong> their larger grain size. It was foundthat the predominant grain orientation plays agreater role in determining the Voc <strong>of</strong> AICcells in fact, <strong>of</strong> the two rightmost triangledata points representing AIC cells atabout 5E16 cm -3 doping in Figure 4.1.1.36,the higher lifetime point originates from(100) preferentially oriented material andthe lower lifetime point comes from (111)preferentially oriented material.1.E-091.E-10All the above evidence points atintragrain defects, as a likely limiton poly-Si thin-film cell lifetimes. In1.E-11particular, dislocations are the most likelycandidates because they provide thestrain fields necessary to create split-<strong>of</strong>fstates from the band edges that can actas shallow levels [4.4.1.36]. To estimate dislocationdensity in poly-Si solar cells a TEM study wasconducted using the Weak-Beam-Dark-Field (DFWB)technique. An example image is shown in Figure4.4.1.37 and the dislocation density deduced by theimage analysis is in the order <strong>of</strong> 1E10 cm -2 . Thereis very rough correlation between the dislocationdensity found in poly-Si solar cells and the cell Voc.The best cells with Voc > 500 mV have dislocationdensity <strong>of</strong> 6~8x10 9 cm -2 , while for the cell with verypoor Voc < 450 mV the dislocation density is about1.5x10 10 cm -2 [4.4.1.37].As the dopant density decreases, the shallowband recombination gradually becomes less andless significant and eventually, at sufficiently lowdopant densities, less than about 5x10 15 cm -3 therecombination involving deep levels starts todominate (process 2 in Figure 4.4.1.32a). Such deeplevels are associated with defects concentrating indislocations and grain boundaries. The defects areusually charged to the same polarity as the majoritycarriers thus creating potential barriers whichattract the minority carriers. The lifetime in this casedepends on the potential barrier heights, whichbecome greater with lowering dopant density.1.00E+15 1.00E+16 1.00E+17 1.00E+18dopant concentration (cmlifetimeat 232K (s)-0.9619y = 462576xR 2 = 0.8161Series1AIC ALICE (n-type)e-beam (n-type)PECVD (ne-beam(p type)PECVD (p-type)Power (Series1)Lifetimes at 232K for various poly-Sithin-film cells plotted againstdopant concentration.Figure 4.4.1.3651