Complete Report - University of New South Wales
Complete Report - University of New South Wales
Complete Report - University of New South Wales
- No tags were found...

Create successful ePaper yourself
Turn your PDF publications into a flip-book with our unique Google optimized e-Paper software.
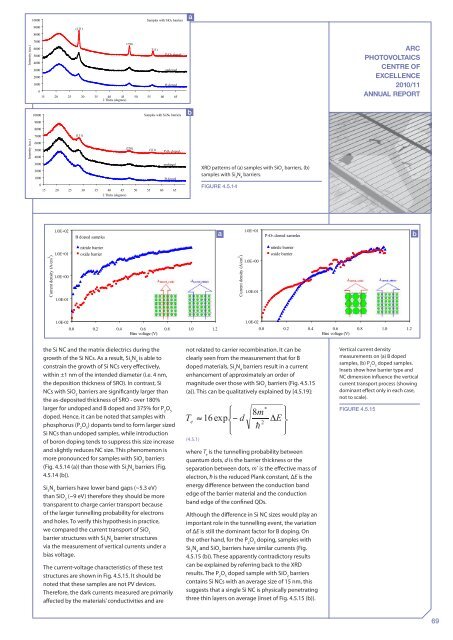
Intensity (a.u.)100009000800070006000500040003000200010000(111)(220)Samples with SiO2 barriers(311)P2O5 dopedundopedB doped15 20 25 30 35 40 45 50 55 60 652 Theta (degrees)ARCPHOTOVOLTAICSCENTRE OFEXCELLENCE2010/11ANNUAL REPORT10000Samples with Si3N4 barriers9000Intensity (a.u.)800070006000500040003000200010000(111)(220)(311)P2O5 dopedundopedB doped15 20 25 30 35 40 45 50 55 60 652 Theta (degrees)XRD patterns <strong>of</strong> (a) samples with SiO 2barriers, (b)samples with Si 3N 4barriers.Figure 4.5.141.0E+02B doped samples1.0E+01P2O5 doped samplesCurrent density (A/cm 2 )1.0E+011.0E+001.0E-01nitride barrieroxide barrierCurrent density (A/cm 2 )1.0E+001.0E-01nitride barrieroxide barrier1.0E-020.0 0.2 0.4 0.6 0.8 1.0 1.2Bias voltage (V)1.0E-020.0 0.2 0.4 0.6 0.8 1.0 1.2Bias voltage (V)the Si NC and the matrix dielectrics during thegrowth <strong>of</strong> the Si NCs. As a result, Si 3N 4is able toconstrain the growth <strong>of</strong> Si NCs very effectively,within ±1 nm <strong>of</strong> the intended diameter (i.e. 4 nm,the deposition thickness <strong>of</strong> SRO). In contrast, SiNCs with SiO 2barriers are significantly larger thanthe as-deposited thickness <strong>of</strong> SRO - over 180%larger for undoped and B doped and 375% for P 2O 5doped. Hence, it can be noted that samples withphosphorus (P 2O 5) dopants tend to form larger sizedSi NCs than undoped samples, while introduction<strong>of</strong> boron doping tends to suppress this size increaseand slightly reduces NC size. This phenomenon ismore pronounced for samples with SiO 2barriers(Fig. 4.5.14 (a)) than those with Si 3N 4barriers (Fig.4.5.14 (b)).Si 3N 4barriers have lower band gaps (~5.3 eV)than SiO 2(~9 eV) therefore they should be moretransparent to charge carrier transport because<strong>of</strong> the larger tunnelling probability for electronsand holes. To verify this hypothesis in practice,we compared the current transport <strong>of</strong> SiO 2barrier structures with Si 3N 4barrier structuresvia the measurement <strong>of</strong> vertical currents under abias voltage.The current-voltage characteristics <strong>of</strong> these teststructures are shown in Fig. 4.5.15. It should benoted that these samples are not PV devices.Therefore, the dark currents measured are primarilyaffected by the materials’ conductivities and arenot related to carrier recombination. It can beclearly seen from the measurement that for Bdoped materials, Si 3N 4barriers result in a currentenhancement <strong>of</strong> approximately an order <strong>of</strong>magnitude over those with SiO 2barriers (Fig. 4.5.15(a)). This can be qualitatively explained by [4.5.19]:(4.5.1)where T eis the tunnelling probability betweenquantum dots, d is the barrier thickness or theseparation between dots, m * is the effective mass <strong>of</strong>electron, ħ is the reduced Plank constant, ΔE is theenergy difference between the conduction bandedge <strong>of</strong> the barrier material and the conductionband edge <strong>of</strong> the confined QDs.Although the difference in Si NC sizes would play animportant role in the tunnelling event, the variation<strong>of</strong> ΔE is still the dominant factor for B doping. Onthe other hand, for the P 2O 5doping, samples withSi 3N 4and SiO 2barriers have similar currents (Fig.4.5.15 (b)). These apparently contradictory resultscan be explained by referring back to the XRDresults. The P 2O 5doped sample with SiO 2barrierscontains Si NCs with an average size <strong>of</strong> 15 nm, thissuggests that a single Si NC is physically penetratingthree thin layers on average (inset <strong>of</strong> Fig. 4.5.15 (b)).Vertical current densitymeasurements on (a) B dopedsamples, (b) P 2O 5doped samples.Insets show how barrier type andNC dimension influence the verticalcurrent transport process (showingdominant effect only in each case,not to scale).Figure 4.5.1569