Census Analytical Report - Uganda Bureau of Statistics
Census Analytical Report - Uganda Bureau of Statistics
Census Analytical Report - Uganda Bureau of Statistics

Create successful ePaper yourself
Turn your PDF publications into a flip-book with our unique Google optimized e-Paper software.
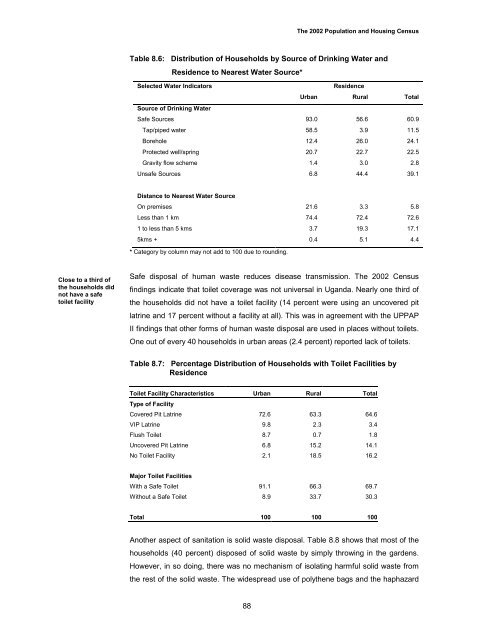
The 2002 Population and Housing <strong>Census</strong>Table 8.6: Distribution <strong>of</strong> Households by Source <strong>of</strong> Drinking Water andResidence to Nearest Water Source*Selected Water IndicatorsResidenceUrban Rural TotalSource <strong>of</strong> Drinking WaterSafe Sources 93.0 56.6 60.9Tap/piped water 58.5 3.9 11.5Borehole 12.4 26.0 24.1Protected well/spring 20.7 22.7 22.5Gravity flow scheme 1.4 3.0 2.8Unsafe Sources 6.8 44.4 39.1Distance to Nearest Water SourceOn premises 21.6 3.3 5.8Less than 1 km 74.4 72.4 72.61 to less than 5 kms 3.7 19.3 17.15kms + 0.4 5.1 4.4* Category by column may not add to 100 due to rounding.Close to a third <strong>of</strong>the households didnot have a safetoilet facilitySafe disposal <strong>of</strong> human waste reduces disease transmission. The 2002 <strong>Census</strong>findings indicate that toilet coverage was not universal in <strong>Uganda</strong>. Nearly one third <strong>of</strong>the households did not have a toilet facility (14 percent were using an uncovered pitlatrine and 17 percent without a facility at all). This was in agreement with the UPPAPII findings that other forms <strong>of</strong> human waste disposal are used in places without toilets.One out <strong>of</strong> every 40 households in urban areas (2.4 percent) reported lack <strong>of</strong> toilets.Table 8.7: Percentage Distribution <strong>of</strong> Households with Toilet Facilities byResidenceToilet Facility Characteristics Urban Rural TotalType <strong>of</strong> FacilityCovered Pit Latrine 72.6 63.3 64.6VIP Latrine 9.8 2.3 3.4Flush Toilet 8.7 0.7 1.8Uncovered Pit Latrine 6.8 15.2 14.1No Toilet Facility 2.1 18.5 16.2Major Toilet FacilitiesWith a Safe Toilet 91.1 66.3 69.7Without a Safe Toilet 8.9 33.7 30.3Total 100 100 100Another aspect <strong>of</strong> sanitation is solid waste disposal. Table 8.8 shows that most <strong>of</strong> thehouseholds (40 percent) disposed <strong>of</strong> solid waste by simply throwing in the gardens.However, in so doing, there was no mechanism <strong>of</strong> isolating harmful solid waste fromthe rest <strong>of</strong> the solid waste. The widespread use <strong>of</strong> polythene bags and the haphazard88