Census Analytical Report - Uganda Bureau of Statistics
Census Analytical Report - Uganda Bureau of Statistics
Census Analytical Report - Uganda Bureau of Statistics
Create successful ePaper yourself
Turn your PDF publications into a flip-book with our unique Google optimized e-Paper software.
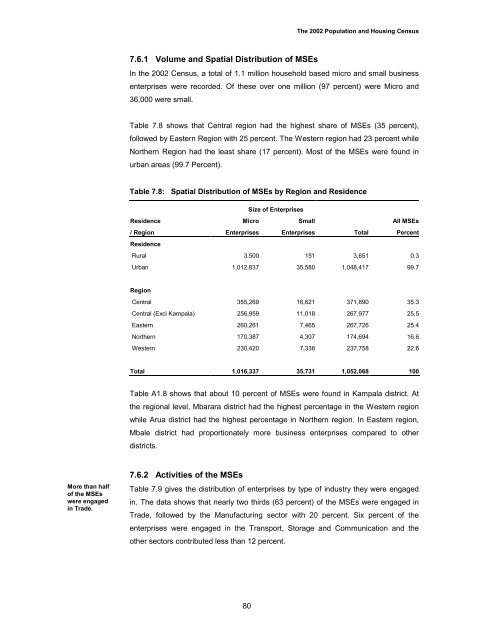
The 2002 Population and Housing <strong>Census</strong>7.6.1 Volume and Spatial Distribution <strong>of</strong> MSEsIn the 2002 <strong>Census</strong>, a total <strong>of</strong> 1.1 million household based micro and small businessenterprises were recorded. Of these over one million (97 percent) were Micro and36,000 were small.Table 7.8 shows that Central region had the highest share <strong>of</strong> MSEs (35 percent),followed by Eastern Region with 25 percent. The Western region had 23 percent whileNorthern Region had the least share (17 percent). Most <strong>of</strong> the MSEs were found inurban areas (99.7 Percent).Table 7.8: Spatial Distribution <strong>of</strong> MSEs by Region and ResidenceSize <strong>of</strong> EnterprisesResidence Micro Small All MSEs/ Region Enterprises Enterprises Total PercentResidenceRural 3,500 151 3,651 0.3Urban 1,012,837 35,580 1,048,417 99.7RegionCentral 355,269 16,621 371,890 35.3Central (Excl Kampala) 256,959 11,018 267,977 25.5Eastern 260,261 7,465 267,726 25.4Northern 170,387 4,307 174,694 16.6Western 230,420 7,338 237,758 22.6Total 1,016,337 35,731 1,052,068 100Table A1.8 shows that about 10 percent <strong>of</strong> MSEs were found in Kampala district. Atthe regional level, Mbarara district had the highest percentage in the Western regionwhile Arua district had the highest percentage in Northern region. In Eastern region,Mbale district had proportionately more business enterprises compared to otherdistricts.More than half<strong>of</strong> the MSEswere engagedin Trade.7.6.2 Activities <strong>of</strong> the MSEsTable 7.9 gives the distribution <strong>of</strong> enterprises by type <strong>of</strong> industry they were engagedin. The data shows that nearly two thirds (63 percent) <strong>of</strong> the MSEs were engaged inTrade, followed by the Manufacturing sector with 20 percent. Six percent <strong>of</strong> theenterprises were engaged in the Transport, Storage and Communication and theother sectors contributed less than 12 percent.80


