Census Analytical Report - Uganda Bureau of Statistics
Census Analytical Report - Uganda Bureau of Statistics
Census Analytical Report - Uganda Bureau of Statistics
Create successful ePaper yourself
Turn your PDF publications into a flip-book with our unique Google optimized e-Paper software.
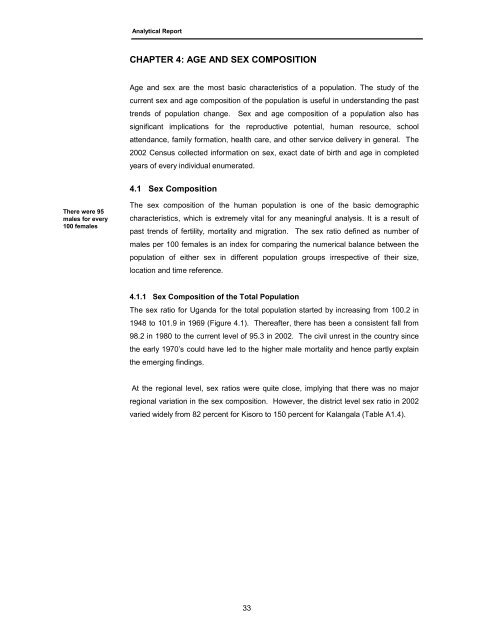
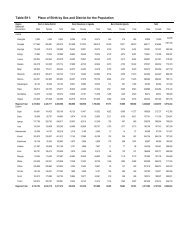
<strong>Analytical</strong> <strong>Report</strong>CHAPTER 4: AGE AND SEX COMPOSITIONAge and sex are the most basic characteristics <strong>of</strong> a population. The study <strong>of</strong> thecurrent sex and age composition <strong>of</strong> the population is useful in understanding the pasttrends <strong>of</strong> population change. Sex and age composition <strong>of</strong> a population also hassignificant implications for the reproductive potential, human resource, schoolattendance, family formation, health care, and other service delivery in general. The2002 <strong>Census</strong> collected information on sex, exact date <strong>of</strong> birth and age in completedyears <strong>of</strong> every individual enumerated.4.1 Sex CompositionThere were 95males for every100 femalesThe sex composition <strong>of</strong> the human population is one <strong>of</strong> the basic demographiccharacteristics, which is extremely vital for any meaningful analysis. It is a result <strong>of</strong>past trends <strong>of</strong> fertility, mortality and migration. The sex ratio defined as number <strong>of</strong>males per 100 females is an index for comparing the numerical balance between thepopulation <strong>of</strong> either sex in different population groups irrespective <strong>of</strong> their size,location and time reference.4.1.1 Sex Composition <strong>of</strong> the Total PopulationThe sex ratio for <strong>Uganda</strong> for the total population started by increasing from 100.2 in1948 to 101.9 in 1969 (Figure 4.1). Thereafter, there has been a consistent fall from98.2 in 1980 to the current level <strong>of</strong> 95.3 in 2002. The civil unrest in the country sincethe early 1970’s could have led to the higher male mortality and hence partly explainthe emerging findings.At the regional level, sex ratios were quite close, implying that there was no majorregional variation in the sex composition. However, the district level sex ratio in 2002varied widely from 82 percent for Kisoro to 150 percent for Kalangala (Table A1.4).33


