Census Analytical Report - Uganda Bureau of Statistics
Census Analytical Report - Uganda Bureau of Statistics
Census Analytical Report - Uganda Bureau of Statistics

Create successful ePaper yourself
Turn your PDF publications into a flip-book with our unique Google optimized e-Paper software.
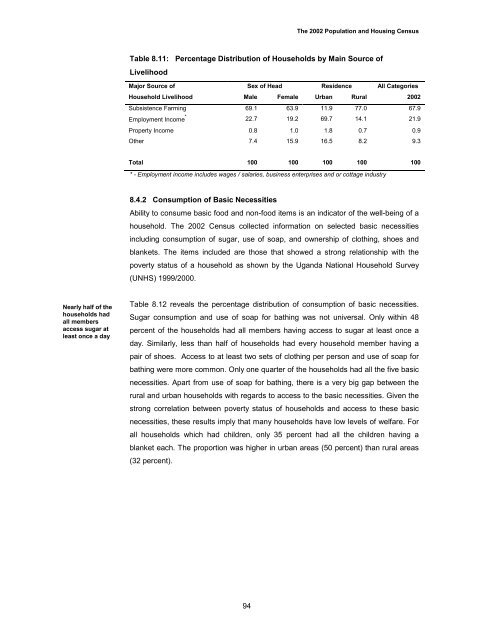
The 2002 Population and Housing <strong>Census</strong>Table 8.11: Percentage Distribution <strong>of</strong> Households by Main Source <strong>of</strong>LivelihoodMajor Source <strong>of</strong>Sex <strong>of</strong> Head Residence All CategoriesHousehold Livelihood Male Female Urban Rural 2002Subsistence Farming 69.1 63.9 11.9 77.0 67.9Employment Income * 22.7 19.2 69.7 14.1 21.9Property Income 0.8 1.0 1.8 0.7 0.9Other 7.4 15.9 16.5 8.2 9.3Total 100 100 100 100 100* - Employment income includes wages / salaries, business enterprises and or cottage industry8.4.2 Consumption <strong>of</strong> Basic NecessitiesAbility to consume basic food and non-food items is an indicator <strong>of</strong> the well-being <strong>of</strong> ahousehold. The 2002 <strong>Census</strong> collected information on selected basic necessitiesincluding consumption <strong>of</strong> sugar, use <strong>of</strong> soap, and ownership <strong>of</strong> clothing, shoes andblankets. The items included are those that showed a strong relationship with thepoverty status <strong>of</strong> a household as shown by the <strong>Uganda</strong> National Household Survey(UNHS) 1999/2000.Nearly half <strong>of</strong> thehouseholds hadall membersaccess sugar atleast once a dayTable 8.12 reveals the percentage distribution <strong>of</strong> consumption <strong>of</strong> basic necessities.Sugar consumption and use <strong>of</strong> soap for bathing was not universal. Only within 48percent <strong>of</strong> the households had all members having access to sugar at least once aday. Similarly, less than half <strong>of</strong> households had every household member having apair <strong>of</strong> shoes. Access to at least two sets <strong>of</strong> clothing per person and use <strong>of</strong> soap forbathing were more common. Only one quarter <strong>of</strong> the households had all the five basicnecessities. Apart from use <strong>of</strong> soap for bathing, there is a very big gap between therural and urban households with regards to access to the basic necessities. Given thestrong correlation between poverty status <strong>of</strong> households and access to these basicnecessities, these results imply that many households have low levels <strong>of</strong> welfare. Forall households which had children, only 35 percent had all the children having ablanket each. The proportion was higher in urban areas (50 percent) than rural areas(32 percent).94