- Page 3: Analytical ReportFOREWORDThe Uganda
- Page 6 and 7: The 2002 Population and Housing Cen
- Page 8 and 9: The 2002 Population and Housing Cen
- Page 10 and 11: The 2002 Population and Housing Cen
- Page 12 and 13: The 2002 Population and Housing Cen
- Page 14 and 15: The 2002 Population and Housing Cen
- Page 16 and 17: The 2002 Population and Housing Cen
- Page 19: The 2002 Population and Housing Cen
- Page 22 and 23: The 2002 Population and Housing Cen
- Page 24 and 25: The 2002 Population and Housing Cen
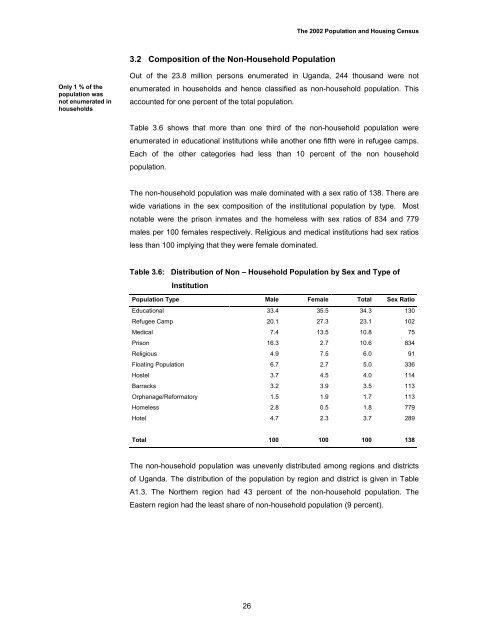
- Page 26 and 27: The 2002 Population and Housing Cen
- Page 28 and 29: The 2002 Population and Housing Cen
- Page 30 and 31: The 2002 Population and Housing Cen
- Page 32 and 33: The 2002 Population and Housing Cen
- Page 34 and 35: The 2002 Population and Housing Cen
- Page 36 and 37: The 2002 Population and Housing Cen
- Page 38 and 39: The 2002 Population and Housing Cen
- Page 40 and 41: The 2002 Population and Housing Cen
- Page 42 and 43: The 2002 Population and Housing Cen
- Page 46 and 47: The 2002 Population and Housing Cen
- Page 48 and 49: The 2002 Population and Housing Cen
- Page 50 and 51: The 2002 Population and Housing Cen
- Page 52 and 53: The 2002 Population and Housing Cen
- Page 54 and 55: The 2002 Population and Housing Cen
- Page 56 and 57: The 2002 Population and Housing Cen
- Page 58 and 59: The 2002 Population and Housing Cen
- Page 60 and 61: The 2002 Population and Housing Cen
- Page 62 and 63: The 2002 Population and Housing Cen
- Page 64 and 65: The 2002 Population and Housing Cen
- Page 66 and 67: The 2002 Population and Housing Cen
- Page 68 and 69: The 2002 Population and Housing Cen
- Page 70 and 71: The 2002 Population and Housing Cen
- Page 72 and 73: The 2002 Population and Housing Cen
- Page 74 and 75: 56The 2002 Population and Housing C
- Page 76 and 77: The 2002 Population and Housing Cen
- Page 78 and 79: The 2002 Population and Housing Cen
- Page 80 and 81: The 2002 Population and Housing Cen
- Page 82 and 83: The 2002 Population and Housing Cen
- Page 84 and 85: 66The 2002 Population and Housing C
- Page 86 and 87: The 2002 Population and Housing Cen
- Page 88 and 89: The 2002 Population and Housing Cen
- Page 90 and 91: The 2002 Population and Housing Cen
- Page 92 and 93: The 2002 Population and Housing Cen
- Page 94 and 95:
The 2002 Population and Housing Cen
- Page 96 and 97:
The 2002 Population and Housing Cen
- Page 98 and 99:
The 2002 Population and Housing Cen
- Page 100 and 101:
The 2002 Population and Housing Cen
- Page 102 and 103:
The 2002 Population and Housing Cen
- Page 104 and 105:
The 2002 Population and Housing Cen
- Page 106 and 107:
The 2002 Population and Housing Cen
- Page 108 and 109:
The 2002 Population and Housing Cen
- Page 110 and 111:
The 2002 Population and Housing Cen
- Page 112 and 113:
The 2002 Population and Housing Cen
- Page 114 and 115:
The 2002 Population and Housing Cen
- Page 116 and 117:
98The 2002 Population and Housing C
- Page 118 and 119:
The 2002 Population and Housing Cen
- Page 120 and 121:
The 2002 Population and Housing Cen
- Page 122 and 123:
The 2002 Population and Housing Cen
- Page 124 and 125:
The 2002 Population and Housing Cen
- Page 126 and 127:
The 2002 Population and Housing Cen
- Page 128 and 129:
The 2002 Population and Housing Cen
- Page 130 and 131:
The 2002 Population and Housing Cen
- Page 132 and 133:
The 2002 Population and Housing Cen
- Page 134 and 135:
The 2002 Population and Housing Cen
- Page 136 and 137:
The 2002 Population and Housing Cen
- Page 138 and 139:
The 2002 Population and Housing Cen
- Page 140 and 141:
The 2002 Population and Housing Cen
- Page 142 and 143:
The 2002 Population and Housing Cen
- Page 144 and 145:
The 2002 Population and Housing Cen
- Page 146 and 147:
The 2002 Population and Housing Cen
- Page 148 and 149:
The 2002 Population and Housing Cen
- Page 150 and 151:
The 2002 Population and Housing Cen
- Page 152 and 153:
The 2002 Population and Housing Cen
- Page 154 and 155:
The 2002 Population and Housing Cen
- Page 156 and 157:
138Analytical Report
- Page 158 and 159:
Analytical Report11.3 Embracing rel
- Page 160 and 161:
Analytical ReportThe appropriate le
- Page 162 and 163:
Analytical ReportList of References
- Page 164 and 165:
Analytical ReportAnnex 1: Appendix
- Page 166 and 167:
Analytical ReportA1.2: Distribution
- Page 168 and 169:
Analytical ReportA1.3: Selected Ind
- Page 170 and 171:
Analytical ReportA1.4: Selected Age
- Page 172 and 173:
Analytical ReportA1.5: Selected Mar
- Page 174 and 175:
Analytical ReportA1.7: Literacy and
- Page 176 and 177:
Analytical ReportA1.8: Selected Eco
- Page 178 and 179:
Analytical ReportA1.9: Percentage o
- Page 180 and 181:
Analytical ReportA1.10: Percentage
- Page 182 and 183:
Analytical ReportA1.11: Distributio
- Page 184 and 185:
Analytical ReportA1.11 Ctd: Distrib
- Page 186 and 187:
Analytical ReportAnnex 2: Glossary
- Page 188 and 189:
Analytical ReportEducational Attain
- Page 190 and 191:
Analytical ReportHousehold Faciliti