Census Analytical Report - Uganda Bureau of Statistics
Census Analytical Report - Uganda Bureau of Statistics
Census Analytical Report - Uganda Bureau of Statistics

Create successful ePaper yourself
Turn your PDF publications into a flip-book with our unique Google optimized e-Paper software.
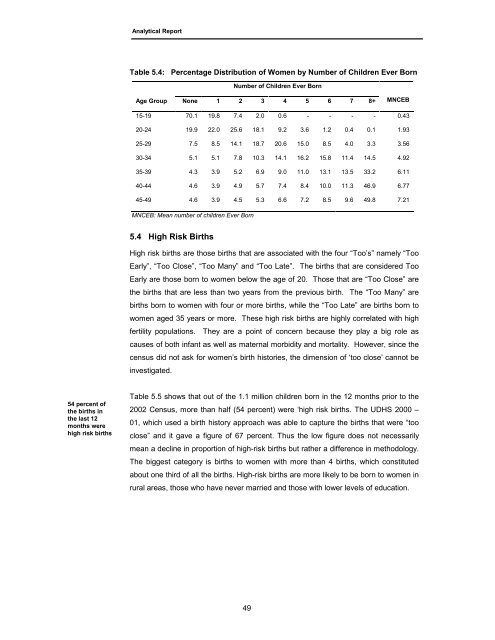
<strong>Analytical</strong> <strong>Report</strong>Table 5.4: Percentage Distribution <strong>of</strong> Women by Number <strong>of</strong> Children Ever BornNumber <strong>of</strong> Children Ever BornAge Group None 1 2 3 4 5 6 7 8+ MNCEB15-19 70.1 19.8 7.4 2.0 0.6 - - - - 0.4320-24 19.9 22.0 25.6 18.1 9.2 3.6 1.2 0.4 0.1 1.9325-29 7.5 8.5 14.1 18.7 20.6 15.0 8.5 4.0 3.3 3.5630-34 5.1 5.1 7.8 10.3 14.1 16.2 15.8 11.4 14.5 4.9235-39 4.3 3.9 5.2 6.9 9.0 11.0 13.1 13.5 33.2 6.1140-44 4.6 3.9 4.9 5.7 7.4 8.4 10.0 11.3 46.9 6.7745-49 4.6 3.9 4.5 5.3 6.6 7.2 8.5 9.6 49.8 7.21MNCEB: Mean number <strong>of</strong> children Ever Born5.4 High Risk BirthsHigh risk births are those births that are associated with the four “Too’s” namely “TooEarly”, “Too Close”, “Too Many” and “Too Late”. The births that are considered TooEarly are those born to women below the age <strong>of</strong> 20. Those that are “Too Close” arethe births that are less than two years from the previous birth. The “Too Many” arebirths born to women with four or more births, while the “Too Late” are births born towomen aged 35 years or more. These high risk births are highly correlated with highfertility populations. They are a point <strong>of</strong> concern because they play a big role ascauses <strong>of</strong> both infant as well as maternal morbidity and mortality. However, since thecensus did not ask for women’s birth histories, the dimension <strong>of</strong> ‘too close’ cannot beinvestigated.54 percent <strong>of</strong>the births inthe last 12months werehigh risk birthsTable 5.5 shows that out <strong>of</strong> the 1.1 million children born in the 12 months prior to the2002 <strong>Census</strong>, more than half (54 percent) were ‘high risk births. The UDHS 2000 –01, which used a birth history approach was able to capture the births that were “tooclose” and it gave a figure <strong>of</strong> 67 percent. Thus the low figure does not necessarilymean a decline in proportion <strong>of</strong> high-risk births but rather a difference in methodology.The biggest category is births to women with more than 4 births, which constitutedabout one third <strong>of</strong> all the births. High-risk births are more likely to be born to women inrural areas, those who have never married and those with lower levels <strong>of</strong> education.49