Census Analytical Report - Uganda Bureau of Statistics
Census Analytical Report - Uganda Bureau of Statistics
Census Analytical Report - Uganda Bureau of Statistics
You also want an ePaper? Increase the reach of your titles
YUMPU automatically turns print PDFs into web optimized ePapers that Google loves.
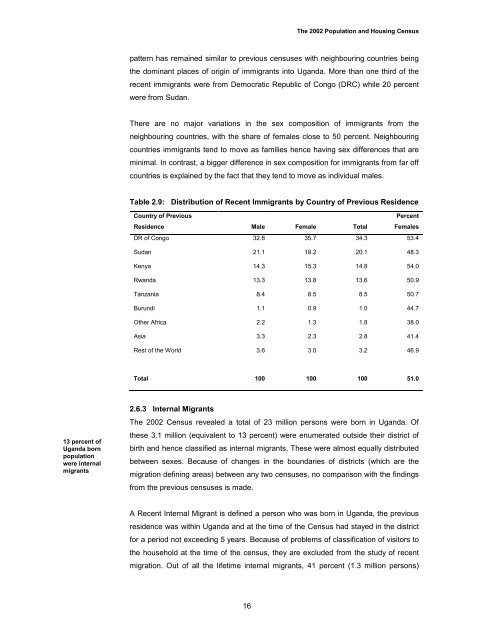
The 2002 Population and Housing <strong>Census</strong>pattern has remained similar to previous censuses with neighbouring countries beingthe dominant places <strong>of</strong> origin <strong>of</strong> immigrants into <strong>Uganda</strong>. More than one third <strong>of</strong> therecent immigrants were from Democratic Republic <strong>of</strong> Congo (DRC) while 20 percentwere from Sudan.There are no major variations in the sex composition <strong>of</strong> immigrants from theneighbouring countries, with the share <strong>of</strong> females close to 50 percent. Neighbouringcountries immigrants tend to move as families hence having sex differences that areminimal. In contrast, a bigger difference in sex composition for immigrants from far <strong>of</strong>fcountries is explained by the fact that they tend to move as individual males.Table 2.9: Distribution <strong>of</strong> Recent Immigrants by Country <strong>of</strong> Previous ResidenceCountry <strong>of</strong> PreviousResidence Male Female TotalPercentFemalesDR <strong>of</strong> Congo 32.8 35.7 34.3 53.4Sudan 21.1 19.2 20.1 48.3Kenya 14.3 15.3 14.8 54.0Rwanda 13.3 13.8 13.6 50.9Tanzania 8.4 8.5 8.5 50.7Burundi 1.1 0.9 1.0 44.7Other Africa 2.2 1.3 1.8 38.0Asia 3.3 2.3 2.8 41.4Rest <strong>of</strong> the World 3.6 3.0 3.2 46.9Total 100 100 100 51.013 percent <strong>of</strong><strong>Uganda</strong> bornpopulationwere internalmigrants2.6.3 Internal MigrantsThe 2002 <strong>Census</strong> revealed a total <strong>of</strong> 23 million persons were born in <strong>Uganda</strong>. Ofthese 3.1 million (equivalent to 13 percent) were enumerated outside their district <strong>of</strong>birth and hence classified as internal migrants. These were almost equally distributedbetween sexes. Because <strong>of</strong> changes in the boundaries <strong>of</strong> districts (which are themigration defining areas) between any two censuses, no comparison with the findingsfrom the previous censuses is made.A Recent Internal Migrant is defined a person who was born in <strong>Uganda</strong>, the previousresidence was within <strong>Uganda</strong> and at the time <strong>of</strong> the <strong>Census</strong> had stayed in the districtfor a period not exceeding 5 years. Because <strong>of</strong> problems <strong>of</strong> classification <strong>of</strong> visitors tothe household at the time <strong>of</strong> the census, they are excluded from the study <strong>of</strong> recentmigration. Out <strong>of</strong> all the lifetime internal migrants, 41 percent (1.3 million persons)16


