Census Analytical Report - Uganda Bureau of Statistics
Census Analytical Report - Uganda Bureau of Statistics
Census Analytical Report - Uganda Bureau of Statistics

You also want an ePaper? Increase the reach of your titles
YUMPU automatically turns print PDFs into web optimized ePapers that Google loves.
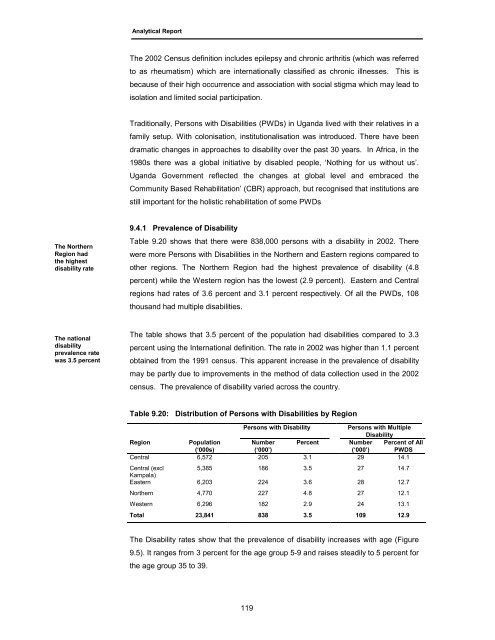
<strong>Analytical</strong> <strong>Report</strong>The 2002 <strong>Census</strong> definition includes epilepsy and chronic arthritis (which was referredto as rheumatism) which are internationally classified as chronic illnesses. This isbecause <strong>of</strong> their high occurrence and association with social stigma which may lead toisolation and limited social participation.Traditionally, Persons with Disabilities (PWDs) in <strong>Uganda</strong> lived with their relatives in afamily setup. With colonisation, institutionalisation was introduced. There have beendramatic changes in approaches to disability over the past 30 years. In Africa, in the1980s there was a global initiative by disabled people, ‘Nothing for us without us’.<strong>Uganda</strong> Government reflected the changes at global level and embraced theCommunity Based Rehabilitation’ (CBR) approach, but recognised that institutions arestill important for the holistic rehabilitation <strong>of</strong> some PWDsThe NorthernRegion hadthe highestdisability rate9.4.1 Prevalence <strong>of</strong> DisabilityTable 9.20 shows that there were 838,000 persons with a disability in 2002. Therewere more Persons with Disabilities in the Northern and Eastern regions compared toother regions. The Northern Region had the highest prevalence <strong>of</strong> disability (4.8percent) while the Western region has the lowest (2.9 percent). Eastern and Centralregions had rates <strong>of</strong> 3.6 percent and 3.1 percent respectively. Of all the PWDs, 108thousand had multiple disabilities.The nationaldisabilityprevalence ratewas 3.5 percentThe table shows that 3.5 percent <strong>of</strong> the population had disabilities compared to 3.3percent using the International definition. The rate in 2002 was higher than 1.1 percentobtained from the 1991 census. This apparent increase in the prevalence <strong>of</strong> disabilitymay be partly due to improvements in the method <strong>of</strong> data collection used in the 2002census. The prevalence <strong>of</strong> disability varied across the country.Table 9.20: Distribution <strong>of</strong> Persons with Disabilities by RegionPersons with DisabilityPersons with MultipleDisabilityRegionPopulation(‘000s)Number(‘000’)Percent Number(‘000’)Percent <strong>of</strong> AllPWDSCentral 6,572 205 3.1 29 14.1Central (excl5,385 186 3.5 27 14.7Kampala)Eastern 6,203 224 3.6 28 12.7Northern 4,770 227 4.8 27 12.1Western 6,296 182 2.9 24 13.1Total 23,841 838 3.5 109 12.9The Disability rates show that the prevalence <strong>of</strong> disability increases with age (Figure9.5). It ranges from 3 percent for the age group 5-9 and raises steadily to 5 percent forthe age group 35 to 39.119