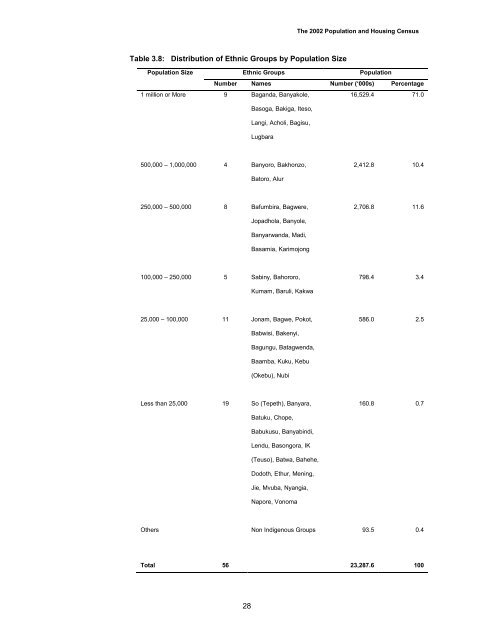
The 2002 Population and Housing <strong>Census</strong>Table 3.8: Distribution <strong>of</strong> Ethnic Groups by Population SizePopulation SizeEthnic GroupsPopulationNumber Names Number (‘000s) Percentage1 million or More 9 Baganda, Banyakole,Basoga, Bakiga, Iteso,Langi, Acholi, Bagisu,Lugbara16,529.4 71.0500,000 – 1,000,000 4 Banyoro, Bakhonzo,2,412.8 10.4Batoro, Alur250,000 – 500,000 8 Bafumbira, Bagwere,2,706.8 11.6Jopadhola, Banyole,Banyarwanda, Madi,Basamia, Karimojong100,000 – 250,000 5 Sabiny, Bahororo,798.4 3.4Kumam, Baruli, Kakwa25,000 – 100,000 11 Jonam, Bagwe, Pokot,586.0 2.5Babwisi, Bakenyi,Bagungu, Batagwenda,Baamba, Kuku, Kebu(Okebu), NubiLess than 25,000 19 So (Tepeth), Banyara,160.8 0.7Batuku, Chope,Babukusu, Banyabindi,Lendu, Basongora, IK(Teuso), Batwa, Bahehe,Dodoth, Ethur, Mening,Jie, Mvuba, Nyangia,Napore, VonomaOthers Non Indigenous Groups 93.5 0.4Total 56 23,287.6 10028
<strong>Analytical</strong> <strong>Report</strong>Table 3.9 shows the trends <strong>of</strong> the 10 most populous ethnic groups during the period1948 to 2002 2 . The Baganda have been the largest tribe since 1948 to 2002. TheIteso who were the second largest tribe up to 1959 were the fifth largest tribe in 2002.On the converse, the Banyankole who were the fourth largest tribe in 1948 becamesecond while the Basoga have maintained the third position.Table 3.9: Distribution <strong>of</strong> <strong>Uganda</strong>n Population by Ethnic Group, 1948 - 2002Percentage DistributionEthnic Groups 1948 1959 1991 2002Populationin 2002(millions)Baganda 17.0 18.2 18.8 17.7 4.13Banyankole 7.9 9.0 10.2 10.0 2.33Basoga 8.7 8.7 8.5 8.9 2.07Bakiga 5.5 8.0 8.7 7.2 1.68Iteso 9.4 9.1 6.2 6.7 1.57Langi 6.4 6.3 6.1 6.4 1.49Acholi 4.3 5.1 4.6 4.9 1.14Bagisu 5.0 5.7 4.7 4.8 1.12Lugbara 3.7 4.1 3.7 4.4 1.02Other <strong>Uganda</strong>ns 33.1 28.8 28.5 31.4 6.76Total 100 100 100 100 23.29There are minority groups in <strong>Uganda</strong> in terms <strong>of</strong> ethnicity, religion, language,numbers, access to power, cultural and economic resources. Although there is nouniversally acceptable definition <strong>of</strong> minority, any disempowerment regardless <strong>of</strong> thenumerical size, should be considered a minority. Table 3.10 shows that there were 15different ethnic groups which had populations <strong>of</strong> less than 25,000 persons henceconstituting less than 0.1 percent <strong>of</strong> the indigenous population.2 NB: The classification <strong>of</strong> ethnic groups has been changing over time. Therefore, part <strong>of</strong> the difference realised is due to subdivision<strong>of</strong> ethnic groups in subsequent censuses.29