Census Analytical Report - Uganda Bureau of Statistics
Census Analytical Report - Uganda Bureau of Statistics
Census Analytical Report - Uganda Bureau of Statistics
Create successful ePaper yourself
Turn your PDF publications into a flip-book with our unique Google optimized e-Paper software.
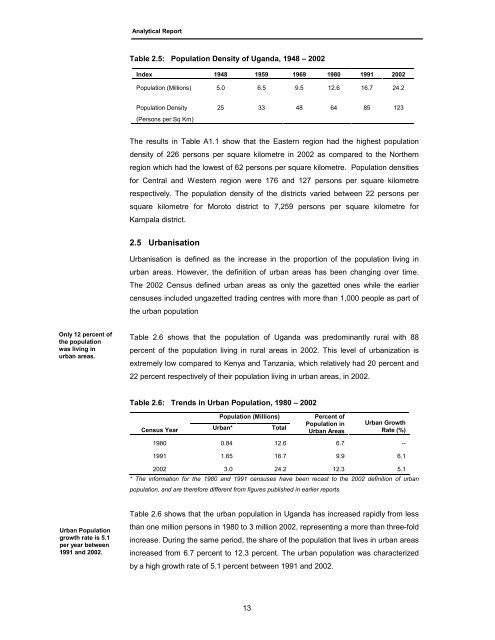
<strong>Analytical</strong> <strong>Report</strong>Table 2.5: Population Density <strong>of</strong> <strong>Uganda</strong>, 1948 – 2002Index 1948 1959 1969 1980 1991 2002Population (Millions) 5.0 6.5 9.5 12.6 16.7 24.2Population Density(Persons per Sq Km)25 33 48 64 85 123The results in Table A1.1 show that the Eastern region had the highest populationdensity <strong>of</strong> 226 persons per square kilometre in 2002 as compared to the Northernregion which had the lowest <strong>of</strong> 62 persons per square kilometre. Population densitiesfor Central and Western region were 176 and 127 persons per square kilometrerespectively. The population density <strong>of</strong> the districts varied between 22 persons persquare kilometre for Moroto district to 7,259 persons per square kilometre forKampala district.2.5 UrbanisationUrbanisation is defined as the increase in the proportion <strong>of</strong> the population living inurban areas. However, the definition <strong>of</strong> urban areas has been changing over time.The 2002 <strong>Census</strong> defined urban areas as only the gazetted ones while the earliercensuses included ungazetted trading centres with more than 1,000 people as part <strong>of</strong>the urban populationOnly 12 percent <strong>of</strong>the populationwas living inurban areas.Table 2.6 shows that the population <strong>of</strong> <strong>Uganda</strong> was predominantly rural with 88percent <strong>of</strong> the population living in rural areas in 2002. This level <strong>of</strong> urbanization isextremely low compared to Kenya and Tanzania, which relatively had 20 percent and22 percent respectively <strong>of</strong> their population living in urban areas, in 2002.Table 2.6: Trends in Urban Population, 1980 – 2002Population (Millions)<strong>Census</strong> Year Urban* TotalPercent <strong>of</strong>Population inUrban AreasUrban GrowthRate (%)1980 0.84 12.6 6.7 --1991 1.65 16.7 9.9 6.12002 3.0 24.2 12.3 5.1* The information for the 1980 and 1991 censuses have been recast to the 2002 definition <strong>of</strong> urbanpopulation, and are therefore different from figures published in earlier reportsUrban Populationgrowth rate is 5.1per year between1991 and 2002.Table 2.6 shows that the urban population in <strong>Uganda</strong> has increased rapidly from lessthan one million persons in 1980 to 3 million 2002, representing a more than three-foldincrease. During the same period, the share <strong>of</strong> the population that lives in urban areasincreased from 6.7 percent to 12.3 percent. The urban population was characterizedby a high growth rate <strong>of</strong> 5.1 percent between 1991 and 2002.13


