Census Analytical Report - Uganda Bureau of Statistics
Census Analytical Report - Uganda Bureau of Statistics
Census Analytical Report - Uganda Bureau of Statistics
You also want an ePaper? Increase the reach of your titles
YUMPU automatically turns print PDFs into web optimized ePapers that Google loves.
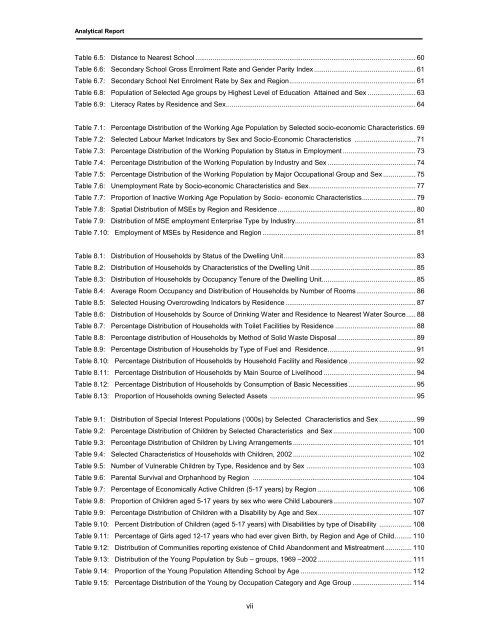
<strong>Analytical</strong> <strong>Report</strong>Table 6.5: Distance to Nearest School ................................................................................................................... 60Table 6.6: Secondary School Gross Enrolment Rate and Gender Parity Index ..................................................... 61Table 6.7: Secondary School Net Enrolment Rate by Sex and Region.................................................................. 61Table 6.8: Population <strong>of</strong> Selected Age groups by Highest Level <strong>of</strong> Education Attained and Sex ......................... 63Table 6.9: Literacy Rates by Residence and Sex................................................................................................... 64Table 7.1: Percentage Distribution <strong>of</strong> the Working Age Population by Selected socio-economic Characteristics. 69Table 7.2: Selected Labour Market Indicators by Sex and Socio-Economic Characteristics ................................ 71Table 7.3: Percentage Distribution <strong>of</strong> the Working Population by Status in Employment ...................................... 73Table 7.4: Percentage Distribution <strong>of</strong> the Working Population by Industry and Sex .............................................. 74Table 7.5: Percentage Distribution <strong>of</strong> the Working Population by Major Occupational Group and Sex ................. 75Table 7.6: Unemployment Rate by Socio-economic Characteristics and Sex........................................................ 77Table 7.7: Proportion <strong>of</strong> Inactive Working Age Population by Socio- economic Characteristics............................ 79Table 7.8: Spatial Distribution <strong>of</strong> MSEs by Region and Residence ........................................................................ 80Table 7.9: Distribution <strong>of</strong> MSE employment Enterprise Type by Industry............................................................... 81Table 7.10: Employment <strong>of</strong> MSEs by Residence and Region ................................................................................ 81Table 8.1: Distribution <strong>of</strong> Households by Status <strong>of</strong> the Dwelling Unit..................................................................... 83Table 8.2: Distribution <strong>of</strong> Households by Characteristics <strong>of</strong> the Dwelling Unit ....................................................... 85Table 8.3: Distribution <strong>of</strong> Households by Occupancy Tenure <strong>of</strong> the Dwelling Unit................................................. 85Table 8.4: Average Room Occupancy and Distribution <strong>of</strong> Households by Number <strong>of</strong> Rooms............................... 86Table 8.5: Selected Housing Overcrowding Indicators by Residence .................................................................... 87Table 8.6: Distribution <strong>of</strong> Households by Source <strong>of</strong> Drinking Water and Residence to Nearest Water Source..... 88Table 8.7: Percentage Distribution <strong>of</strong> Households with Toilet Facilities by Residence .......................................... 88Table 8.8: Percentage distribution <strong>of</strong> Households by Method <strong>of</strong> Solid Waste Disposal......................................... 89Table 8.9: Percentage Distribution <strong>of</strong> Households by Type <strong>of</strong> Fuel and Residence.............................................. 91Table 8.10: Percentage Distribution <strong>of</strong> Households by Household Facility and Residence ................................... 92Table 8.11: Percentage Distribution <strong>of</strong> Households by Main Source <strong>of</strong> Livelihood ................................................ 94Table 8.12: Percentage Distribution <strong>of</strong> Households by Consumption <strong>of</strong> Basic Necessities ................................... 95Table 8.13: Proportion <strong>of</strong> Households owning Selected Assets ............................................................................ 95Table 9.1: Distribution <strong>of</strong> Special Interest Populations (‘000s) by Selected Characteristics and Sex ................... 99Table 9.2: Percentage Distribution <strong>of</strong> Children by Selected Characteristics and Sex ......................................... 100Table 9.3: Percentage Distribution <strong>of</strong> Children by Living Arrangements .............................................................. 101Table 9.4: Selected Characteristics <strong>of</strong> Households with Children, 2002 .............................................................. 102Table 9.5: Number <strong>of</strong> Vulnerable Children by Type, Residence and by Sex ....................................................... 103Table 9.6: Parental Survival and Orphanhood by Region ................................................................................... 104Table 9.7: Percentage <strong>of</strong> Economically Active Children (5-17 years) by Region ................................................. 106Table 9.8: Proportion <strong>of</strong> Children aged 5-17 years by sex who were Child Labourers......................................... 107Table 9.9: Percentage Distribution <strong>of</strong> Children with a Disability by Age and Sex................................................. 107Table 9.10: Percent Distribution <strong>of</strong> Children (aged 5-17 years) with Disabilities by type <strong>of</strong> Disability ................. 108Table 9.11: Percentage <strong>of</strong> Girls aged 12-17 years who had ever given Birth, by Region and Age <strong>of</strong> Child......... 110Table 9.12: Distribution <strong>of</strong> Communities reporting existence <strong>of</strong> Child Abandonment and Mistreatment .............. 110Table 9.13: Distribution <strong>of</strong> the Young Population by Sub – groups, 1969 –2002 ................................................. 111Table 9.14: Proportion <strong>of</strong> the Young Population Attending School by Age .......................................................... 112Table 9.15: Percentage Distribution <strong>of</strong> the Young by Occupation Category and Age Group ............................... 114vii


